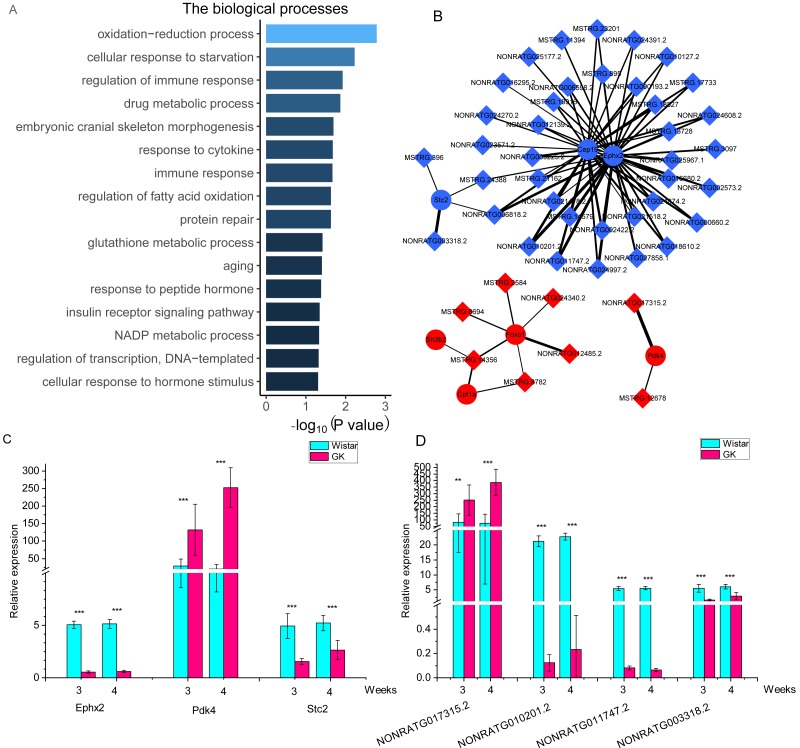
Figure 4. The co-expressed lncRNAs-mRNAs pairs with high correlation coefficients.
(A) The biological process of dysregulated mRNAs in co-expressed lncRNAs-mRNAs pairs with high correlation coefficients. The GO terms of biological process were as follows : GO: 0055114, oxidation-reduction process; GO: 0009267, cellular response to starvation; GO: 0050776, regulation of immune response; GO: 0017144, drug metabolic process; GO: 0048701, embryonic cranial skeleton morphogenesis; GO: 0034097, response to cytokine; GO: 0006955, immune response; GO: 0046320, regulation of fatty acid oxidation; GO: 0030091, protein repair; GO: 0006749, glutathione metabolic process; GO: 0007568, aging; GO: 0043434, response to peptide hormone; GO 0008286, insulin receptor signaling pathway; GO: 0006739, NADP metabolic process; GO 0006355, regulation of transcription, DNA-templated; GO 0032870 cellular response to hormone stimulus. (B) The network of key genes and their co-expressed lncRNAs. The red represents upregulated gene in GK rats compared with aged-matched Wistar rats at the age of 3 and 4 weeks. The blue represents downregulated gene in GK rats compared with aged-matched Wistar rats at the age of 3 and 4 weeks. The diamond represents lncRNA, while the circle represents mRNA. The line between lncRNA and mRNA represents the co-expression coefficient. The range of correlation coefficients was from 0.9 to 0.993573997. (C). The relative expression of Ephx2, Pdk4 and Stc2. (D) The relative expression of NONRATG017315.2, NONRATG010201.2, NONRATG011747.2, and NONRATG003318.2. Values are means ± SD, ∗P < 0.05, ∗∗P < 0.01, ∗∗∗P < 0.001 vs age-matched Wistar group, n = 6.

