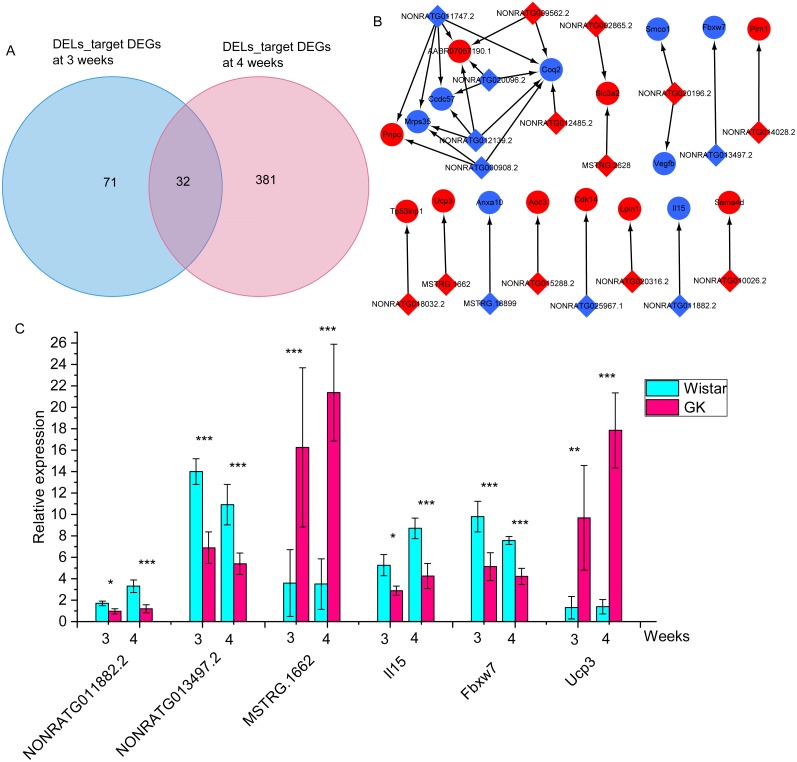
Figure 5. The differentially expressed target mRNAs for differentially expressed lncRNAs.
(A) Venn diagram of lncRNA-target mRNAs at 3 and 4 weeks. The DELs_target DEGs represents the target differentially expressed mRNAs of differentially expressed lncRNAs. (B) The network of overlapping lncRNA-target mRNAs at 3 and 4 weeks. The blue represents downregulated expression in GK rats compared with aged-matched Wistar rats at 3 and 4 weeks. The diamond represents lncRNA, the circle represents mRNA. (C) The relative expression of NONRATG011882.2-Il15, NONRATG013497.2-Fbxw7, and MSTRG.1662-Ucp3. Values are means ± SD, *P < 0.05, **P < 0.01, ***P < 0.001 vs age-matched Wistar group, n = 6. The red represents upregulated expression in GK rats compared with aged-matched Wistar rats at the age of 3 and 4 weeks.

