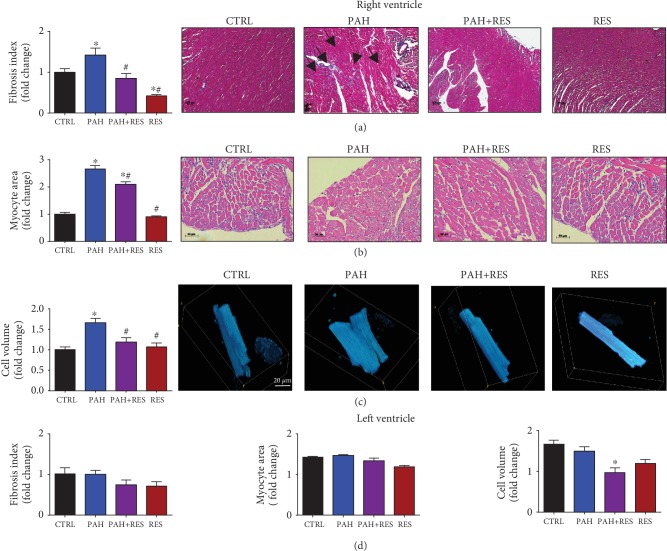
Figure 2.
RES reduces the fibrotic index and myocyte hypertrophy in RV of PAH-treated specimens. (a) Fibrotic index. Representative right ventricles stained with Masson's trichrome of all treated groups (5x). Black arrows indicate the zones of fibrotic tissue. (b) Myocyte area. Representative cross-section cardiomyocytes from groups (H&E, 10x). (c) Cell volume analysis. Representative right ventricle cardiomyocytes stained with calcein and analyzed by confocal microscopy. (d) Unchanged LV morphological features in the PAH model and the lack of effect of RES on these features. Fibrotic index, myocyte area, and isolated cell volume. All data have been normalized to RV CTRL mean values. The values are given as the mean and fold change ± SEM (n = 15 for CTRL, PAH, and PAH+RES; n = 11 for RES). The values are given as the mean and fold change ± SEM; ∗p < 0.05 vs. CTRL; #p < 0.05 vs PAH.

