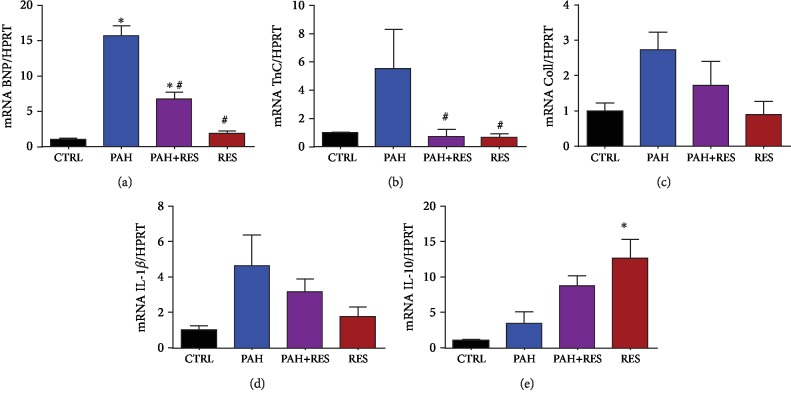
Figure 4.
RES modulates the decrease of tissue remodeling and inflammatory mRNA on the RV of PAH-treated specimens. qPCR analysis of RV from the tissue samples show (a) BNP, (b) troponin C, (c) collagen type 1, (d) IL-1β, and (e) IL-10. All data have been normalized to RV CTRL mean values. The values are given as the mean and fold change ± SEM (n = 4 for CTRL, n = 3 for PAH and PAH+RES, and n = 6 for RES). The values are given as the mean and fold change ± SEM; ∗p < 0.05 vs. control; #p < 0.05 vs. PAH.

