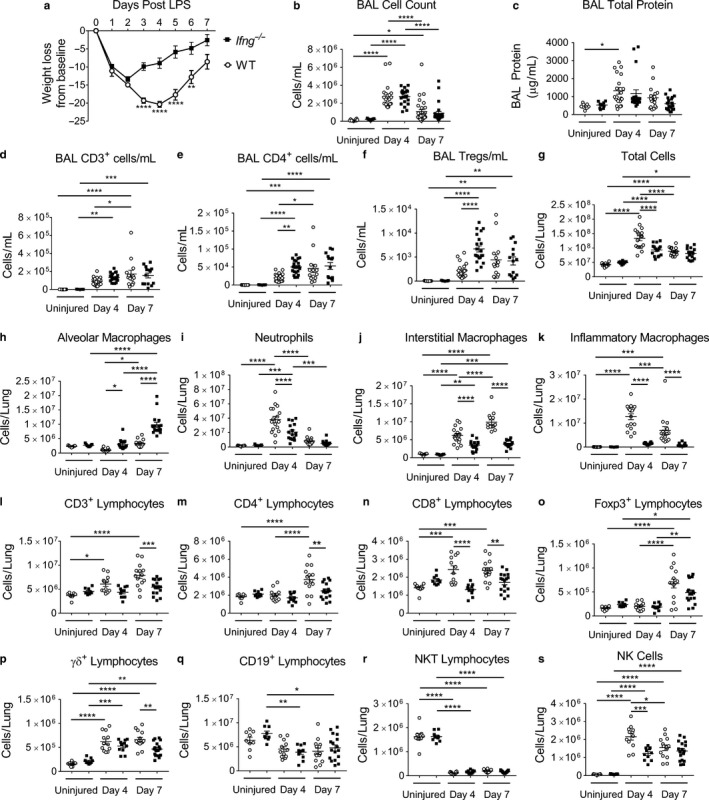
Figure 1.

Interferon‐γ null mice have altered ALI immune cell populations and resolution kinetic parameters. Ifng −/− or WT mice were challenged with intratracheal LPS administered on day 0. Uninjured mice or mice after injury were examined at day 4 or 7 post LPS for injury parameters or immunophenotyping in the BAL compartment or enzymatic single‐cell lung suspensions. (a) Body weight relative to baseline determined after injury (n = 38–49 per group for Ifng −/− mice; n = 35 – 49 per group for WT mice, combining four independent experiments). (b) BAL cell counts and (c) BAL total protein determined for uninjured mice and also on day 4 or 7 after LPS‐induced injury between Ifng −/− or WT mice (n = 9–31 per genotype, combined from 2 or more independent experiments). (d–f) BAL immunophenotyping of CD3+, CD4+, and Tregs in uninjured mice and also at days 4 or 7 post LPS administration (n = 9–22 per group, combined from 2 or more independent experiments). (g) Total lung cell count obtained from lung digests from uninjured mice or obtained from mice at day 4 or 7 post LPS treatment (n = 9–17 per genotype per group, combined data of two independent experiments). (h–k) Changes in macrophage subpopulations and neutrophils as total numbers in single‐cell suspensions determined by flow cytometry with gating adapted from Misharin et al. (2013). (l–s) Changes in CD3+, CD4+, CD8+, Foxp3+, γδ+, CD19+, NK T lymphocyte subsets and NK cells as total numbers in single‐cell suspensions determined using a previously published lymphocyte flow cytometric panel and gating approach (Mock et al., 2019) (n = 9–17 per group, combined from two independent experiments). Data are expressed as the mean ± SEM. p values determined by two‐way ANOVA with the Sidak's multiple comparison test. *p < .05, **p < .01 ***p < .001, ****p < .0001
