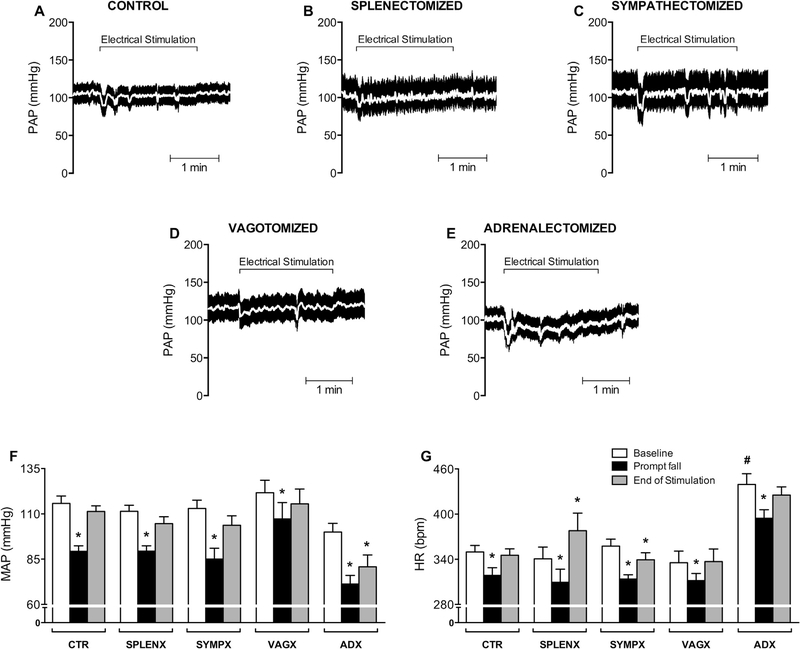
Fig. 1.
Hemodynamic responses to electrical stimulation of the aortic depressor nerve. Tracing of pulsatile arterial pressure (PAP) [white line represents mean arterial pressure] during 2 min of electrical stimulation of the aortic depressor nerve. (A) Control (CTR; n = 9); (B) splenectomized (SPLENX; n = 5); (C) sympathectomized (SYMPX; n = 8); (D) vagotomized (VAGX; n = 6); (E) adrenalectomized (ADX; n = 4) animals. Bar graphs (F and G) show the mean arterial pressure (MAP) and heart rate (HR). Bars represent mean ± standard error. *p < 0.05 compared to baseline within of each group; #p < 0.05 compared to baseline in all other groups (Two-way ANOVA for repeated measures followed by the Tukey’s post hoc test).

