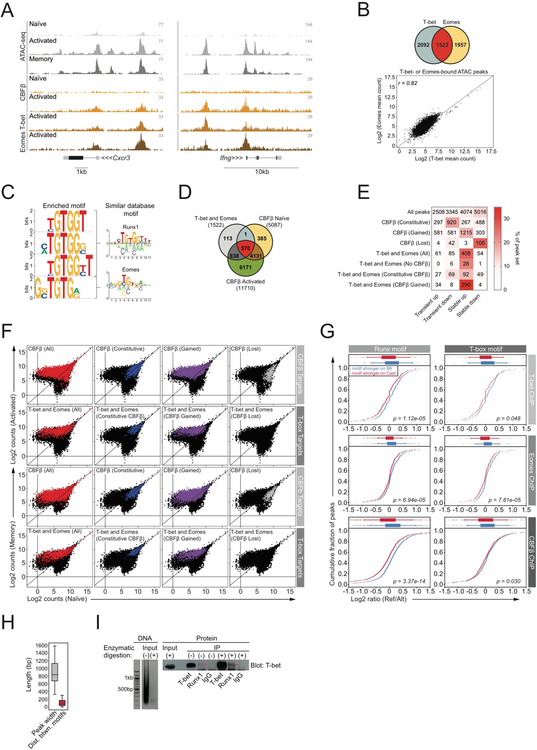
Figure 5: Cooperative binding of T-box and Runx family members regulates stable chromatin accessibility gains in activated T cells.
A) ATAC-seq and ChIP-seq tracks from B6/Cast F1 cells.
B) Overlap between ATAC-seq peaks bound by T-bet and Eomes (top), and Pearson correlation between T-bet and Eomes read counts (bottom). T-bet ChIP was performed on technical replicates from 7 pooled B6/Cast F1 mice. Eomes ChIP was performed on 3 technical replicates from bulk in vitro expanded cells from a single B6/Cast F1 mouse (see methods).
C) T-box and Runx motifs enriched at ATAC-seq peaks bound by both T-bet and Eomes. De novo identified motifs (left), similar database motifs (right).
D) Overlap between T-bet and Eomes binding and CBFβ/Runx binding. Number of peaks bound by each TF is indicated. CBFβ ChIP was performed on bulk naïve (4 technical replicates) and activated (5 technical replicates) CD8 T cell populations from 4–6 pooled B6/Cast F1 mice per replicate.
E) TF binding to ATAC-seq peak groups undergoing stable and transient changes in accessibility. Showing the number of ChIP-seq targets falling in each of the ATAC-seq categories. Color indicates fraction of the ChIP-seq peak sets belonging to each of the ATAC-seq categories, e.g. ~34% of T-bet and Eomes targets that gain CBFβ upon T cell activation belong to the “stable up” ATAC-seq peak category. CBFβ (Constitutive): sites bound by CBFβ in both naïve and activated T cells. CBFβ (lost): sites bound by CBFβ in naïve, but not activated T cells. CBFβ (gained): sites bound by CBFβ in activated, but not naive T cells.
F) Chromatin accessibility changes at TF-bound ATAC-seq peaks in naïve vs activated (top) and naïve vs. memory CD8 T cells (bottom).
G) Effect of Runx and T-box motif variants on TF binding. Mean allelic ratio of TF binding was compared between peaks with stronger motif matches on the B6 allele and peaks with stronger motif matches on the Cast allele using a t-test.
H) Average ATAC-seq peak width and average distance between Runx and T-box motifs when both are present within the same peak.
I) DNA gel showing input sample subject to either sonication alone or sonication and enzymatic digestion with a chromatin-shearing enzyme cocktail (left). Input samples were used for immunoprecipitation followed by western blot analysis with a T-bet antibody. Red stars indicate T-bet protein that was immunoprecipitated with Runx1. Bulk activated CD8 T cells from 5 pooled B6 mice were used to generate input material.

