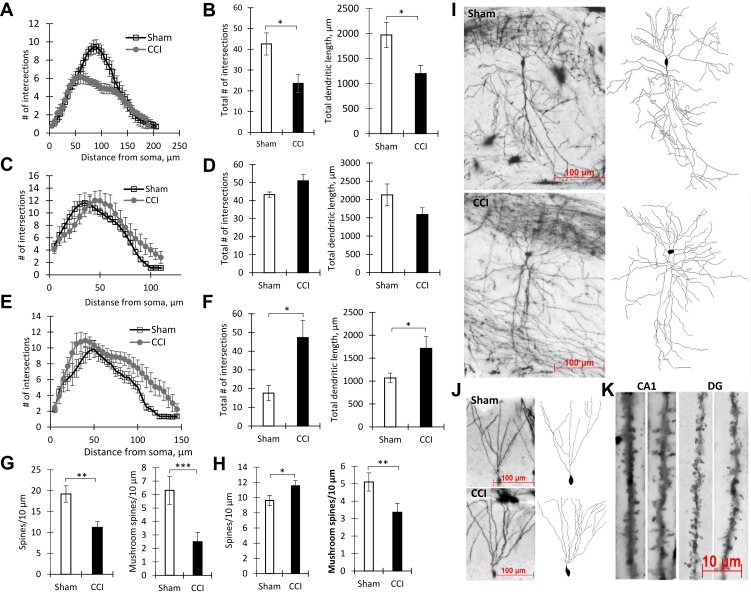
Figure 2.
The results of dendrite Sholl analysis and spines density measurement. (A) Number of intersections along the apical dendritic trees at all distances from the soma in CA1 pyramidal neurons, Mean ± SEM, n=5 (number of animals). (B) The total number of branches (left, *p=0.0317) and the total length of apical dendrites (right, *p=0.0317) of CA1 pyramidal neurons, n=5 (number of animals). (C) The number of intersections along the basal dendritic trees at all distances from the soma of CA1 pyramidal neurons, n=5 (number of animals). (D) The total number of branches (left, p=0.22) and the total length of basal dendrites (right, p=0.84) of CA1 pyramidal neurons, n=5 (number of animals). (E) Number of Sholl intersections along the basal dendritic trees at all distances from the soma of DG granule neurons, n=5 (number of animals). (F) The total number of branches (left, *p=0.0159) and the total length of dendrites (right, *p=0.0159) of DG granule neurons, n=5 (number of animals). (G) Density of CA1 pyramidal neurons dendritic spines: total – left (**p=0.0014), mushroom – right (***P<0.0001), n=15 (number of analyzed neurons). (H) Density of DG granule neurons dendritic spines: total – left (*p=0.0283), mushroom – right (**p=0.006), n=15 (number of analyzed neurons). (I) The images of CA1 pyramidal neurons stained by the Golgi-Cox method from the Sham (upper) and CCI (lower) groups. (J) The images of DG granule neurons stained by the Golgi-Cox method from Sham (upper) and CCI (lower) groups. (K) The images of dendritic spines in the CA1-region and DG in Sham (left) and CCI (right) groups.

