Figure 1.
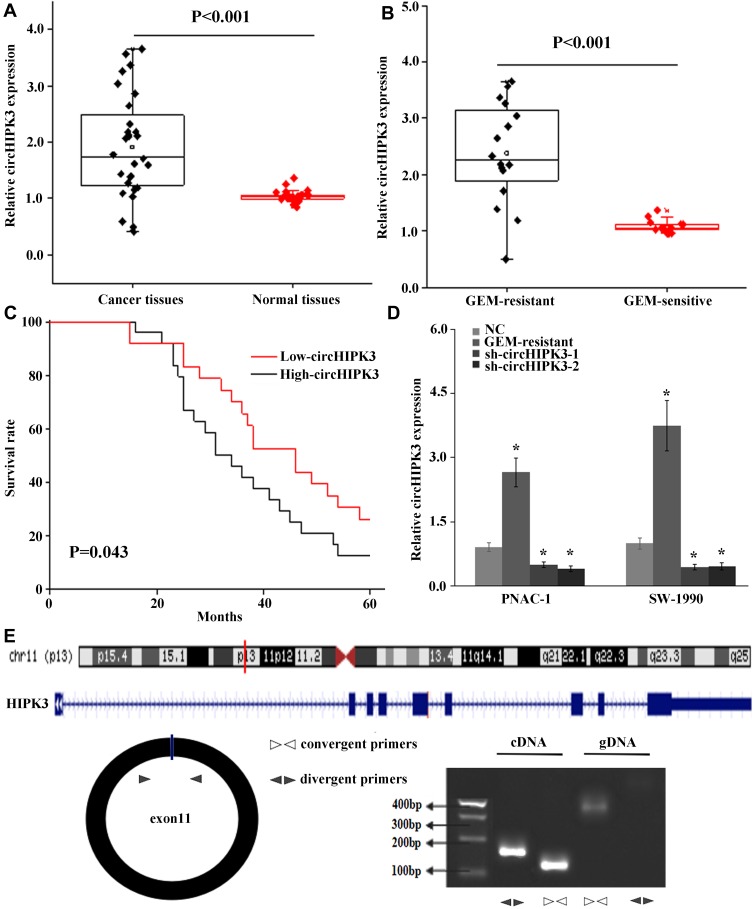
CircHIPK3 was increased in PC tissues and GEM-resistant PC tissues. (A) qRT-PCR analysis of expression levels of circHIPK3 in PC tissues compared with normal tissues. (B) The expression levels of circHIPK3 in PC tissues with GEM-sensitive compared with GEM-resistant. (C) The survival rate was evaluated by Kaplan–Meier curve between high and low circHIPK3 expression groups. (D) qRT-PCR analysis of expression levels of circHIPK3 in PANC-1 and SW 1990 compared with PANC-1-GEM and SW 1990-GEM. (E) The schematic diagram of divergent and convergent primers and the location of circHIPK3, and below is the result of agarose gel electrophoresis after qRT-PCR using cDNA and gDNA, respectively. Data represent mean ± SD. *P < 0.05.

