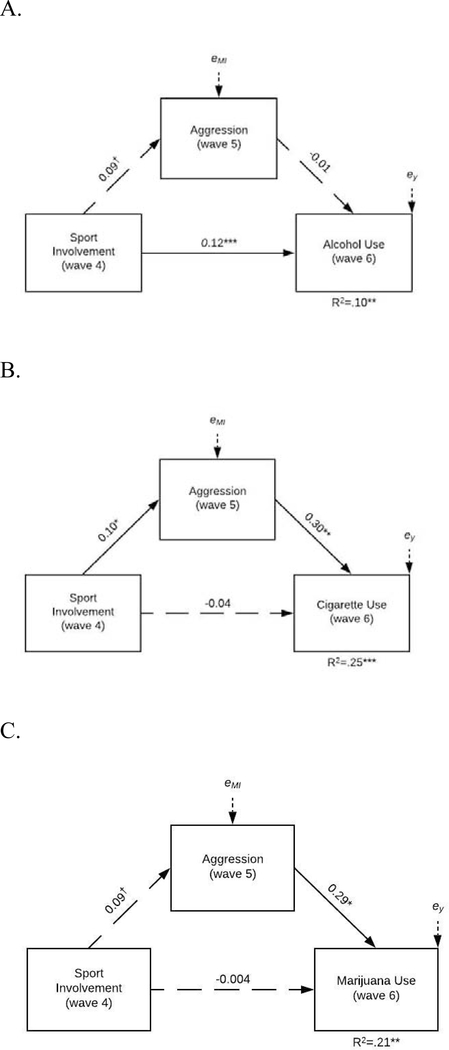
Figure 2.
Path models for alcohol, cigarette, and marijuana use. Values represent standardized path coefficients, and standard errors. Significant paths (p < .05) are presented with a solid line; * p < .05, ** p < .01, *** p <.001, † indicates a marginal association (p < .06). Covariates and covariances are not depicted. Panel A includes alcohol use as the outcome, Panel B includes cigarette use as the outcome, and Panel C includes marijuana use as the outcome. All models were just-identified; thus, model fit indices are not provided.

