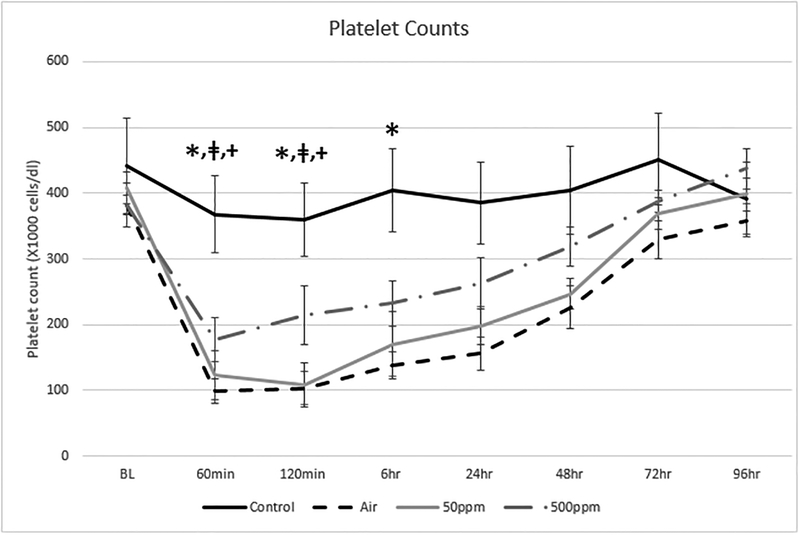
Figure 2: Changes in Platelet Counts in the 4 test groups.
The values are expressed as the mean and standard deviation. There was a significant decline in platelets between the Control and Air groups*: p= 0.0122, Control and 50 ppm groupsǂ: p=0.0225 and Control and 500 ppm groups+: p=0.0358 after 120 minutes of ECC. There was only a significant difference between the Control and Air groups* at 6 hours; p=0.0122.

