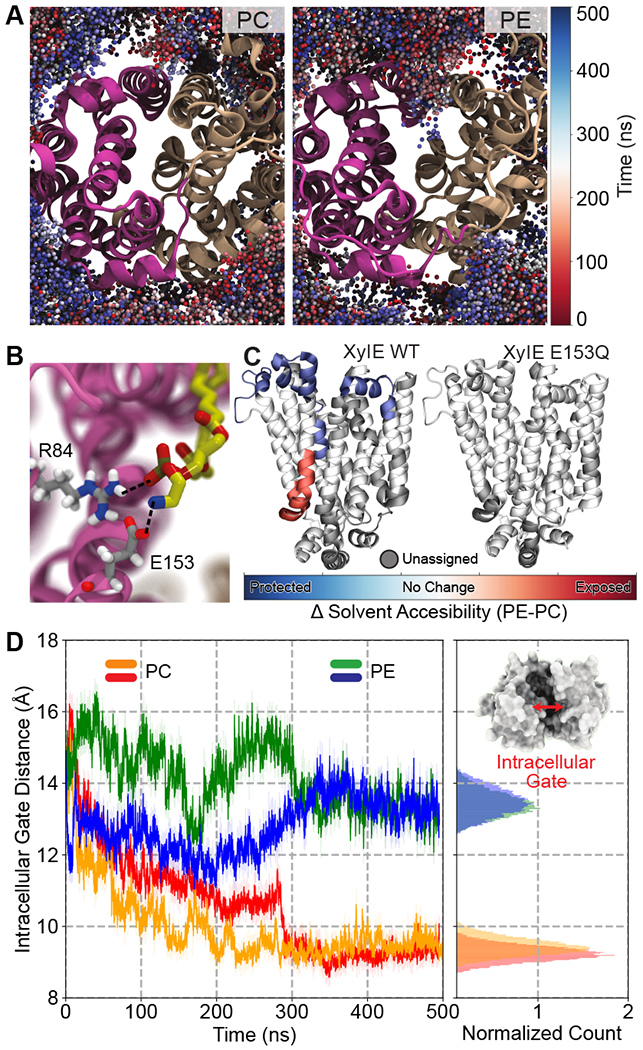
Figure 3. Lipid-protein interactions modulate the conformational dynamics of membrane transporters.

(A) Preferential interaction of PE lipids with IF XylE. Shown is the lipid headgroup sampling in PC (left) and PE (right). Spheres represent phosphorus atoms of PE/PC lipids and are color coded: red at t = 0 and blue at t = 500 ns. A significantly deeper penetration of PE lipids is discernable. (B) Zoomed in snapshot depicting specific interactions between a PE lipid headgroup and a salt bridge within the lumen of the protein, viewed from the intracellular side. No such interaction was observed for PC lipids, as they don’t visit this space. (C) Differential solvent accessibility in PE vs. PC lipid environment, for XylE wildtype and the E153Q mutant. Solvent accessibility, as measured by HDX-MS experiments, is mapped onto the structure depicted by the following color code: red (solvent exposed), blue (protected), white (no change) and grey (unassigned). (D) Time trace showing the intracellular gate distance over simulation time. PC simulation sets are colored orange and red, while the PE simulation sets are colored green and blue. Inset shows a representative snapshot of the protein viewed from the intracellular side highlighting the intracellular gate. Adapted with permission from ref [47]. Copyright 2018 Martens et al. Licensed under a Creative Commons Attribution 4.0 International License.
