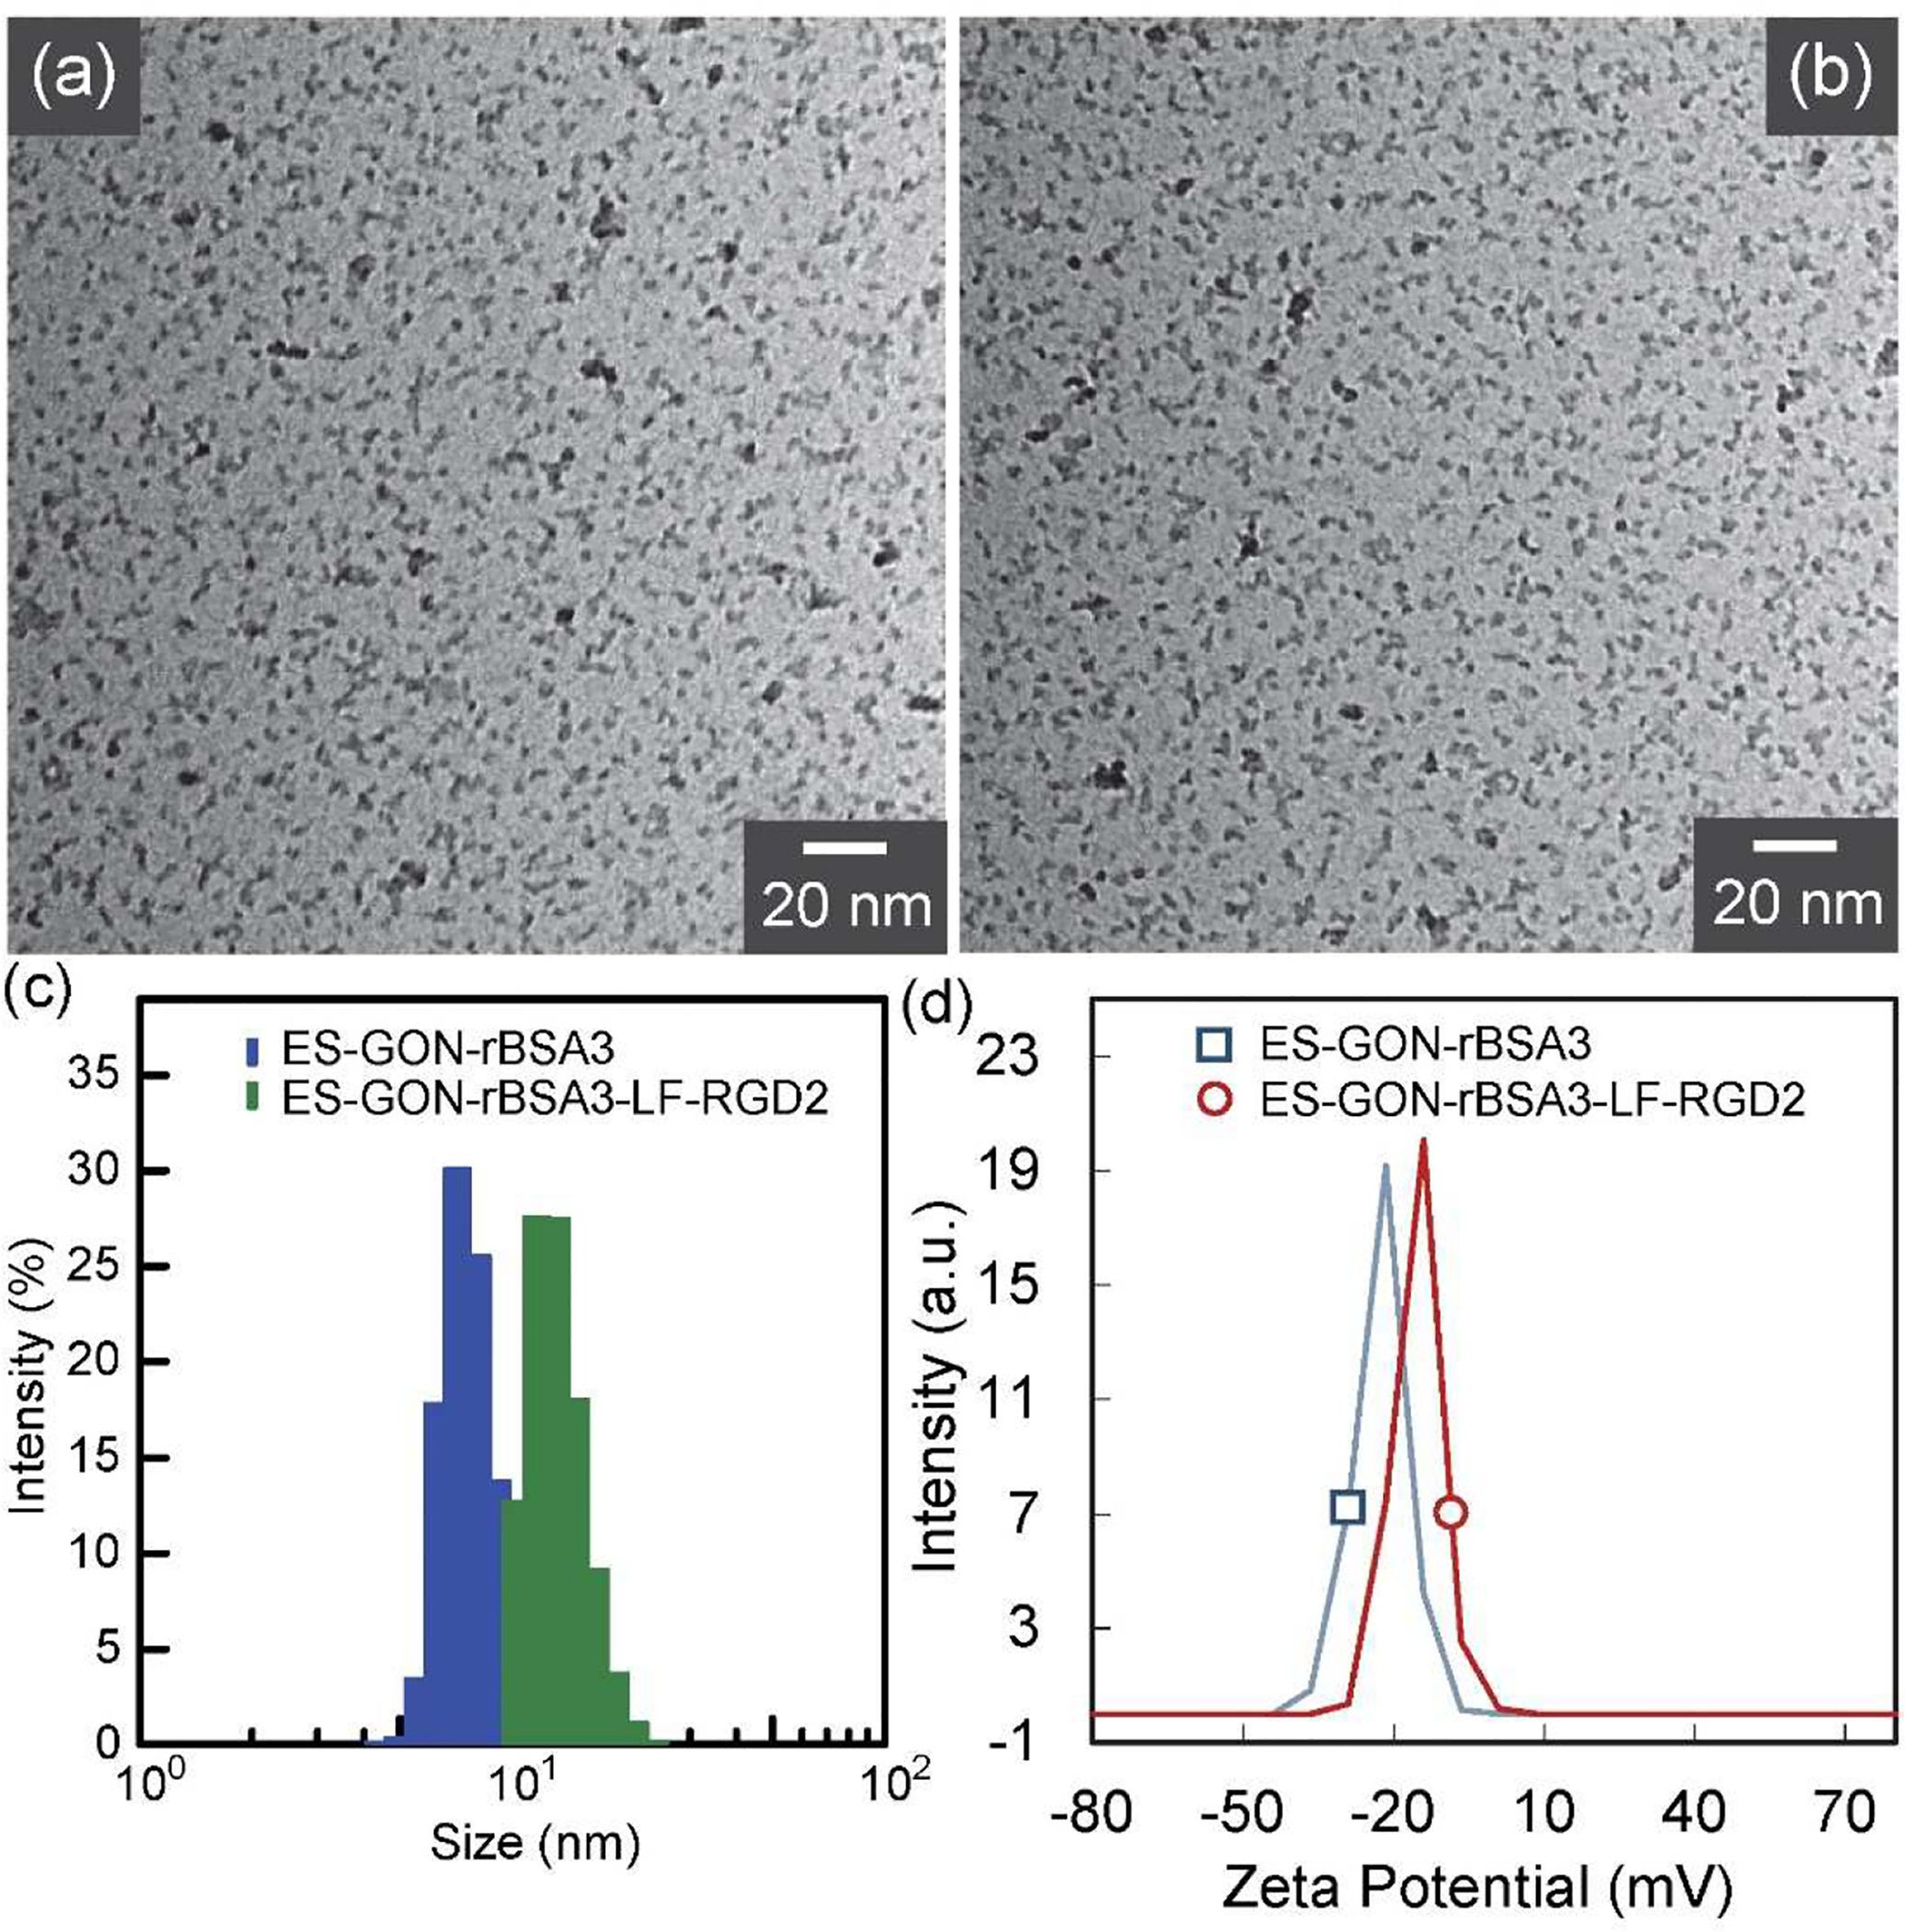
Figure 3.

(a, b): TEM images of ES-GON-rBSA3 (a), and ES-GON-rBSA3-LF-RGD2 (b). (c): Size distribution of ES-GON-rBSA3 (dh = 7.8 nm), and ES-GON-rBSA3-LF-RGD2 (dh = 13.4 nm) determined by DLS. (d): Zeta potential measurement of ES-GON-rBSA3 (−22.5 mV), and ES-GON-rBSA3-LF-RGD2 (−15.2 mV).
