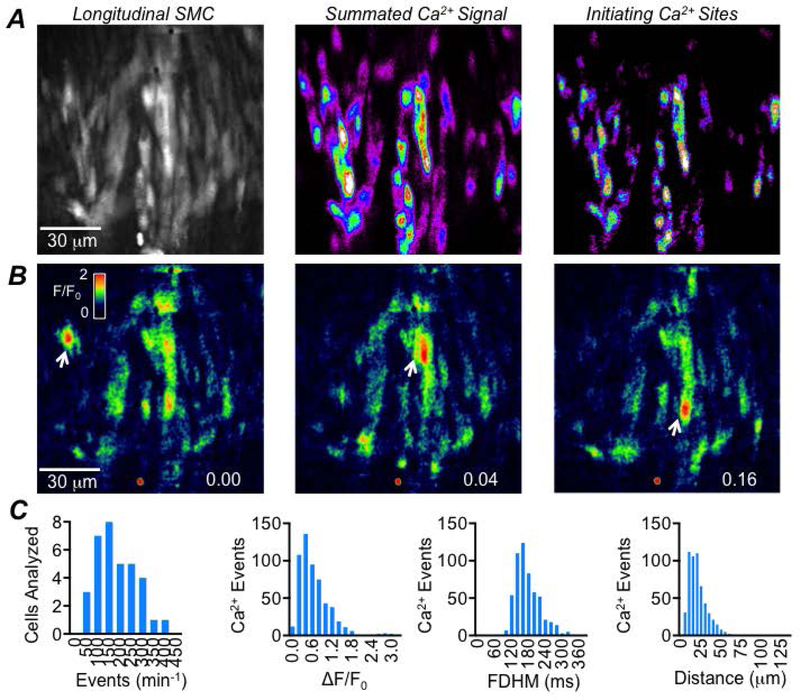
Fig. 1: LSMC intracellular Ca2+ waves.
A Raw image of LSMCs (left panel) recorded in situ from the proximal colon of a SmHC-Cre-GCaMP6f mouse (60x objective; scale bar pertains to all panels in A). The middle panel shows summed intracellular Ca2+ waves occurring during a 20 sec recording. The panel on the right shows the initiation sites from which intracellular Ca2+ waves originated from in this FOV. B Time-lapse images showing the occurrence of intracellular Ca2+ waves over 0.16 sec with the firing of these events indicated by the white arrows. C Frequency histograms showing the range of values of intracellular Ca2+ wave frequency, amplitude, duration and spatial spread in LSMC, c=34, n=5.

