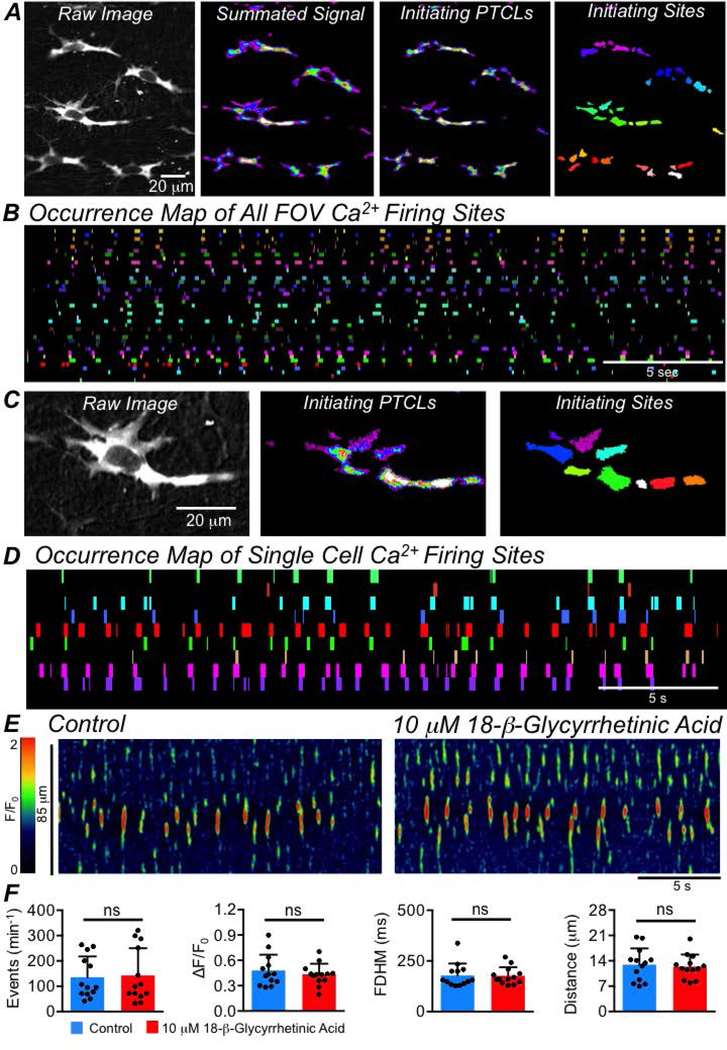
Fig. 6: ICC-SS Ca2+ signaling is not entrained or coupled.
A Far left panel shows a raw image of multiple ICC-SS in a FOV. The panel to the right shows summed Ca2+ transients in the ICC-SS during a 20 sec recording period. The next panel shows an accumulation map of Ca2+ transient initiation sites during 20 sec (initiating PTCLs). The far right panel shows colour coded Ca2+ firing sites from which Ca2+ transients were initiated. B Occurrence map of Ca2+ firing sites shown in the field of view (FOV) in the far right panel of A. Ca2+ firing sites are placed into individual colour coded lanes and plotted against time. C The far left panel is a raw image of a single ICC-SS taken from an in situ recording. The middle panel shows an accumulation map of Ca2+ transient initiation sites during a 20 sec recording. The far right panel shows colour coded Ca2+ firing sites where Ca2+ transients were initiated. D Occurrence map of all Ca2+ firing sites in a single ICC-SS shown in C. The Ca2+ firing sites are placed into individual colour coded lanes and plotted against time. E STMs showing the effect of the gap junction inhibitor 18 β-glycyrrhetinic acid (18 β-GA, 10 μM) on Ca2+ transients in ICC-SS. F Summary data showing the effect of 18 β-GA on ICC Ca2+ transient frequency, amplitude, duration and spatial spread, c=13, n=4.

