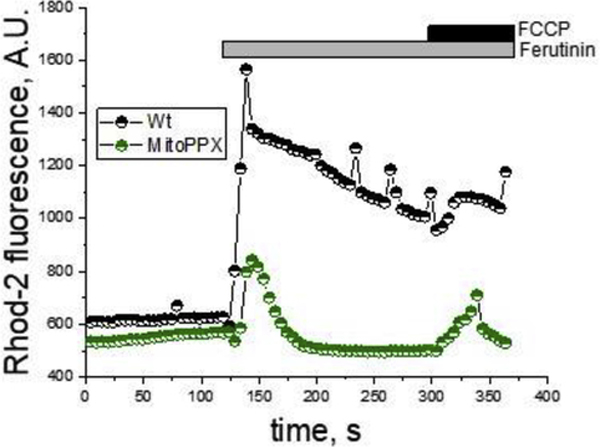
Figure 4.
Mitochondrial free calcium in the presence of the calcium ionophore ferutinin. Mitochondrial free calcium was monitored for six minutes, using the fluorescence probe Rhod-2, in intact Wt and MitoPPX cells. After two minutes, 50μM ferutinin were added to the recording solution. Moreover, at minute five, 1μM FCCP was also added, in order to depolarize the mitochondrial membrane, inducing the release of the remaining calcium from the organelle. The graph shows a representative trace of a typical experiment. The experiments were repeated at, least, three independent times, in duplicate each time. At least 15 ROIs from each glass were analyzed. Note that, despite similar levels of membrane potential and same concentration of ferutinin, mitochondrial free calcium signal was higher in Wt cells, compared with the MitoPPX cells.

