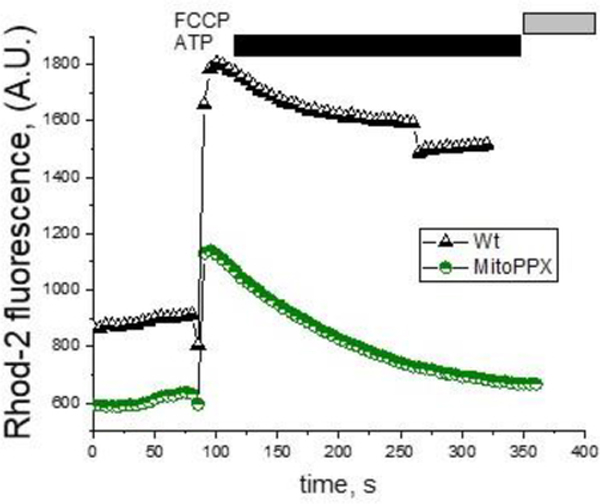
Figure 5.
Mitochondrial free calcium in the presence of the inhibitor of the mitochondrial calcium-sodium exchanger (NCLX). Cells were pretreated with 10μM CGP-37157 for five minutes, a well-known selective inhibitor of the NCLX and thus, of the mitochondrial calcium efflux. After that, live experiments to monitor mitochondrial free calcium using the fluorescence probe Rhod-2 were conducted. Following a similar scheme as in the previous figures, cells were plated in appropriate microscope chambers and the fluorescence signal was recorded for a total time of six minutes. 100μM ATP were added at time = 1 min and during the last minute of the recording, 1μM FCCP was also added to the solution, in order to depolarize the mitochondrial membrane, inducing the release of the remaining calcium from the organelle. The graph shows a representative trace of a typical experiment. Note the significantly higher levels of mitochondrial free calcium in the Wt cells, compared with the MitoPPX cells.

