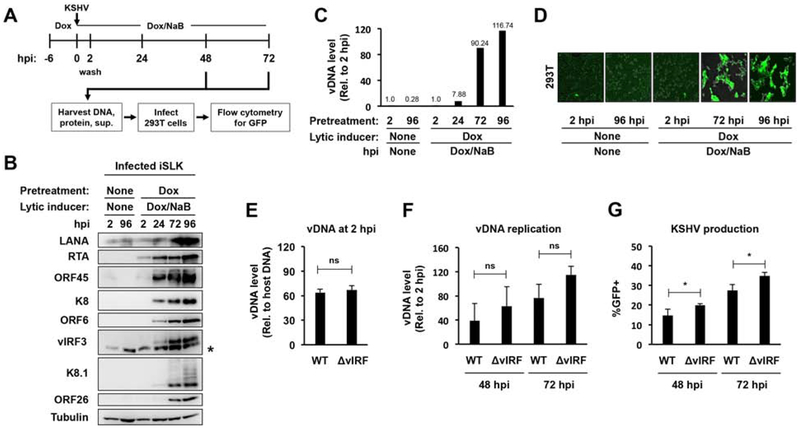
Figure 6. Testing the requirement of vIRFs for KSHV production following lytic infection of iSLK-preRTA cells.
(A) Schematic for the analysis of de novo lytic infection of iSLK-preRTA cells. Note that RTA was pre-expressed in iSLK cells for 6 hours before KSHV infection. (B) Immunoblot analysis of viral protein expression. The asterisk marks non-specific band. (C) Viral DNA replication was measured by qPCR. (D) Representative GFP images of infected 293T cells. (E) Viral DNA level at 2 hpi was measured by qPCR. (F) Viral DNA replication in cells was measured by qPCR, which was calculated relative to 2 hpi. (G) Measuring KSHV production using GFP flow cytometry. Error bars represent standard deviation (n=3). (ns: non-significant, *p<0.05).

