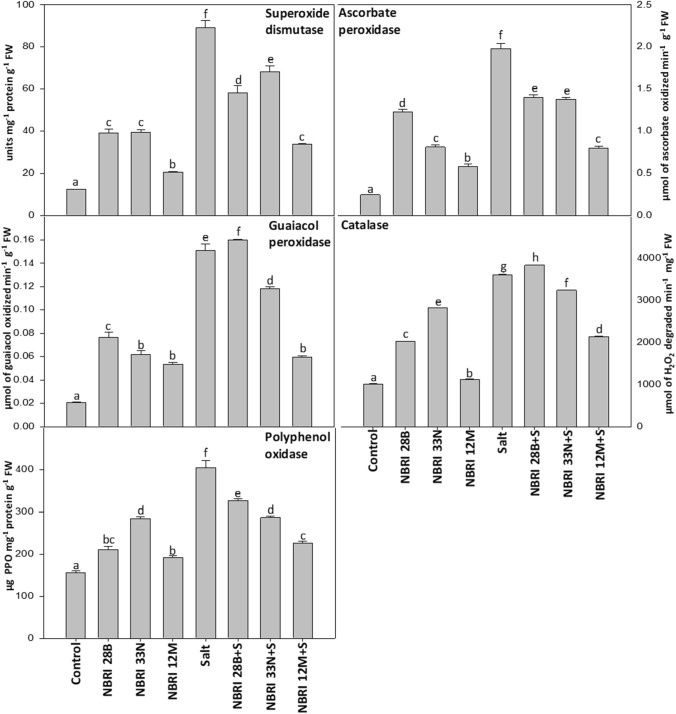
Fig. 3.
Defense enzyme activities in maize leaves. The values shown here are the mean of three replicates. Errors bars represent standard errors. Different letters above the bars represent significant differences according to the analysis of variance (ANOVA), followed by the Duncan test (p ≤ 0.05) applied using the software SPSS ver 20.0

