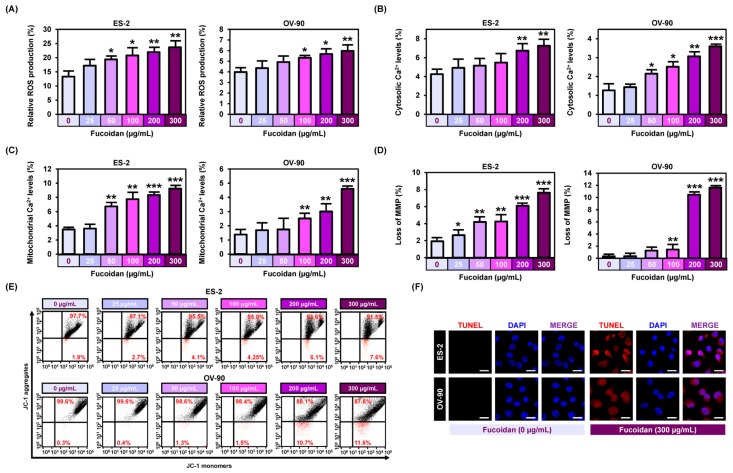
Figure 2.
Induction of reactive oxygen species (ROS) production, calcium ion regulation, and mitochondrial membrane permeabilization by fucoidan. (A) ROS generation by fucoidan was estimated through dichlorofluorescein (DCF) fluorescence intensity using flow cytometry. (B) Flow cytometric observation of cytosolic Ca2+ in response to 48 h incubation with dose dependent fucoidan by staining ES-2 and OV-90 cells with Fluo-4. (C) Flow cytometric observation of mitochondrial Ca2+ concentrations in ES-2 and OV-90 cells in response to fucoidan by staining with Rhod-2. (D,E) Flow cytometric observation of mitochondrial membrane potential (MMP) in ES-2 and OV-90 cells treated with fucoidan by staining with JC-1 dye. Loss of MMP was estimated through JC-1 red and green fluorescence ratios. (F) Terminal deoxynucleotidyl transferase dNTP nick end labeling (TUNEL) detected apoptosis (red) and the cells were counter-stained with DAPI (blue) in ES-2 and OV-90 cells. Scale bar indicates 40 µm. *** p < 0.001, ** p < 0.01, and * p < 0.05 indicate significant difference.

