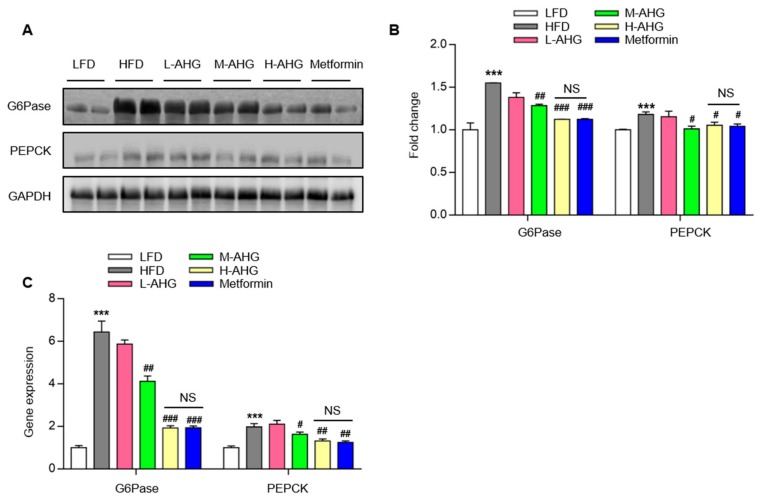
Figure 5.
Effects of AHG supplementation on gluconeogenesis in insulin resistant mice induced with HFD. C57BL/6J mice were fed with HFD for 12 weeks and treated with low, medium and high doses (20, 50 and 100 mg/kg/day, respectively) of AHG for eightweeks. (A) The protein levels of G6Pase and PEPCK in livers were measured by Western blot. (B) Quantification of protein levels of G6Pase and PEPCK was performed by Image J. GAPDH as a control to normalize the expression of the protein. Data are showed as mean ± SD, n = 3; (C) Gene expression of G6Pase and PEPCK in livers were quantified by RT-PCR. Data are shown as mean ± SD, n = 4; *p < 0.5, **p < 0.1, ***p < 0.01 vs. LFD group, #p < 0.5, ##p < 0.1, ###p < 0.01 vs. HFD group.

