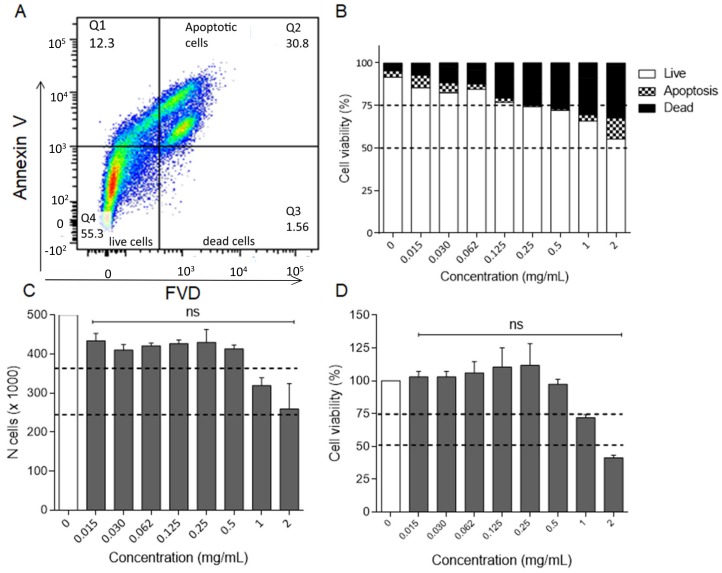
Figure 3.
(A) LPS-activated cells were treated for 24 h with OLE at the indicated concentrations. Cells were stained using the PerCP-Annexin V and FVD 780 and analyzed by flow cytometry. Annexin V/FVD—double negative cells (lower left quadrant) represented live cells, annexin V/FVD—double positive cells (upper right quadrant) represented apoptotic cells and annexin V-negative/FVD-positive cells (lower right quadrant) indicated dead cells. A representative dot plot is shown. The percentage of viable, apoptotic and dead cells was reported in (B) for each OLE concentration. Data are the mean percentage of two different experiments. Evaluation of OLE cytotoxicity and safety on HaCaT cell line by (C) Trypan Blue exclusion and (D) MTT assays. Dotted lines indicate the 50% and 75% of cell viability. ns, not significant OLE-treated versus untreated group (one-way ANOVA test).

