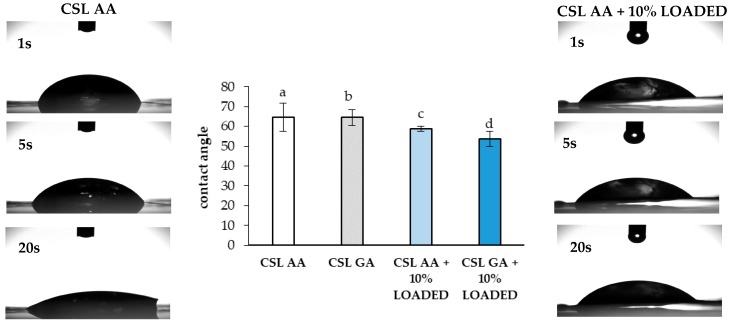
Figure 12.
Contact angle values observed after 20 s for the CS-based films with and without 10% LOADED nanofibers (mean values ± s.d.; n = 3). As an example, images of the drop at different times (1, 5, and 20 s) are reported for CSL AA film in presence and in absence of the nanofibers. ANOVA one-way; Multiple Range Test (p ≤ 0.05): a vs. c; b vs. d.

