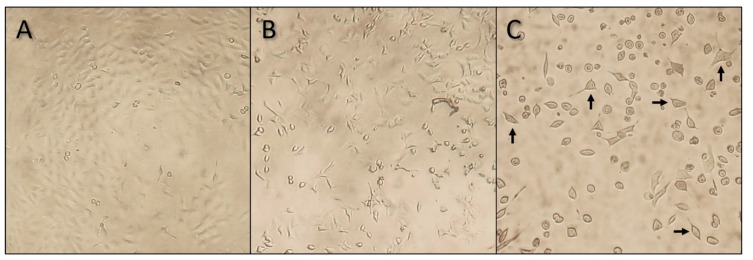
Figure 2.
Microscopic images (100× magnification) of A549 cells after a 43-h treatment with pure YTX. The three different images represent three different concentration treatments: (A) negative control without YTX, (B) 0.5 µg YTX·L−1, and (C) 400 µg YTX·L−1. These visual observations are in line with the cell viability results. In the negative treatment (A), a nearly confluent cell culture can be seen. In the mid (B) and high (C) concentration treatments, cell cultures become less confluent and an increasing number of cells lose their normal cell morphology and deform into round cells. In the high concentration treatment (C), a few cells with a more or less normal cell morphology, as indicated with the arrows, are still present.

