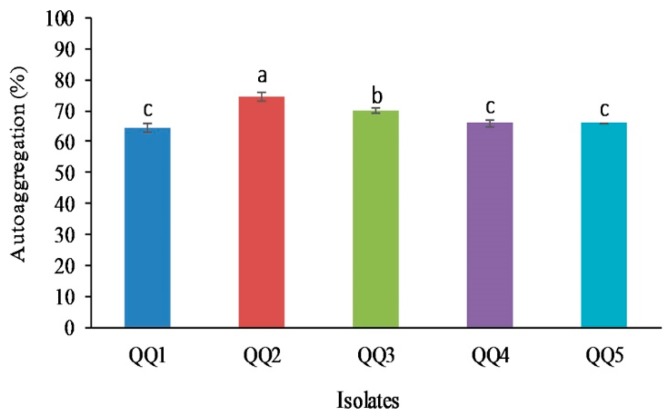
Figure 8.
The percentage of auto-aggregation in quorum quenching bacteria (Mean ± SD, n = 3). Different alphabets represent a significant difference between isolates (P < 0.05). The rating of means was performed as follows a (4), b (3), c (2). The total score of each isolate was QQ1 (2), QQ2 (4), QQ3 (3), QQ4 (2), QQ5 (2).

