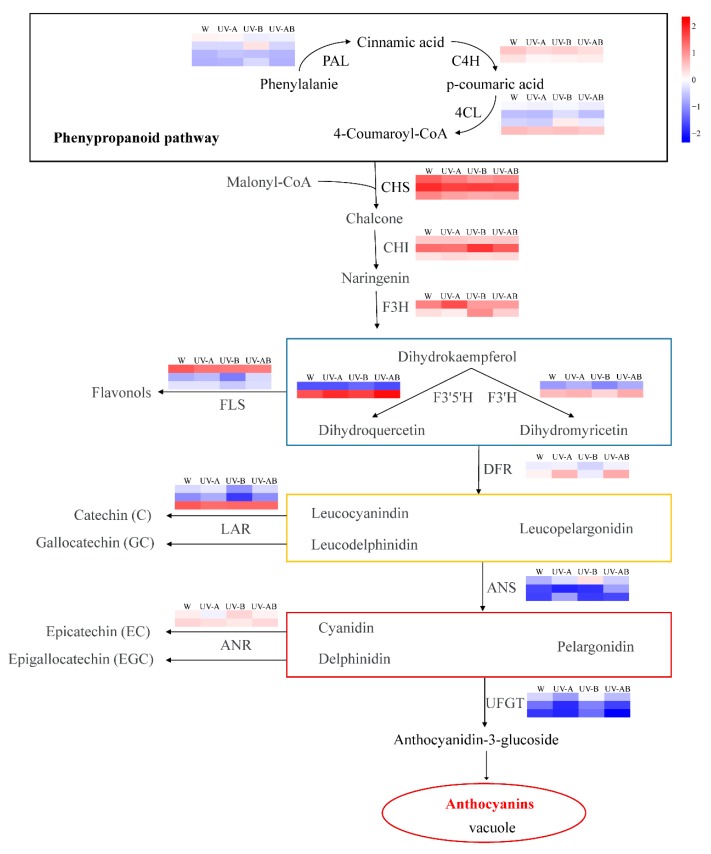
Figure 7.
Expression patterns of the genes involved in anthocyanin biosynthesis in different treatments. The color scale at the right represents the normalized value of log10 (FPKM), and FPKM (fragments per kilobase of transcript per million mapped reads) values obtained from RNA-Seq data. The expression levels for each gene are shown by colors ranging from low (blue) to high (red).

