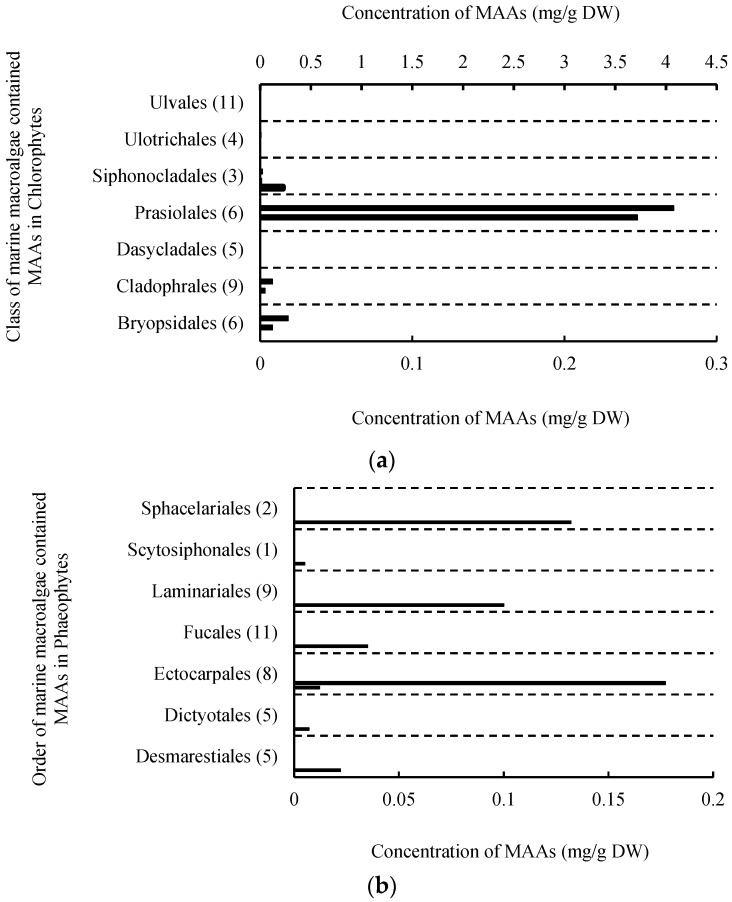
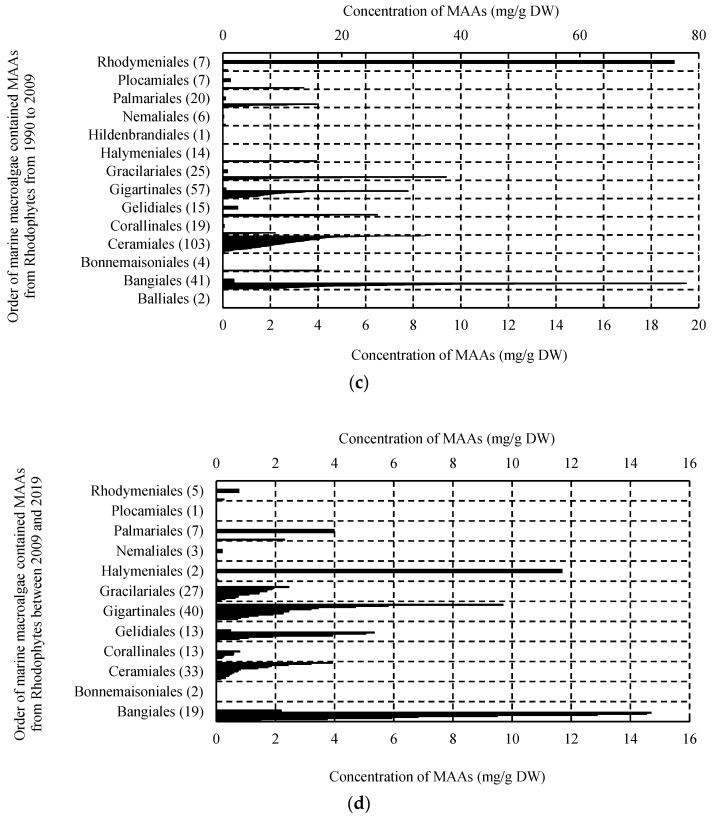
Figure 3.
The contents of total MAAs in different orders of marine macroalgae. Data extracted from related studies since 1990. The number in bracket represents the number of species included in orders, bar represents a marine macroalgae with corresponding MAAs in (a–d), and the bars with different widths represent the numbers of some marine macroalgae with corresponding MAAs in (c,d).


