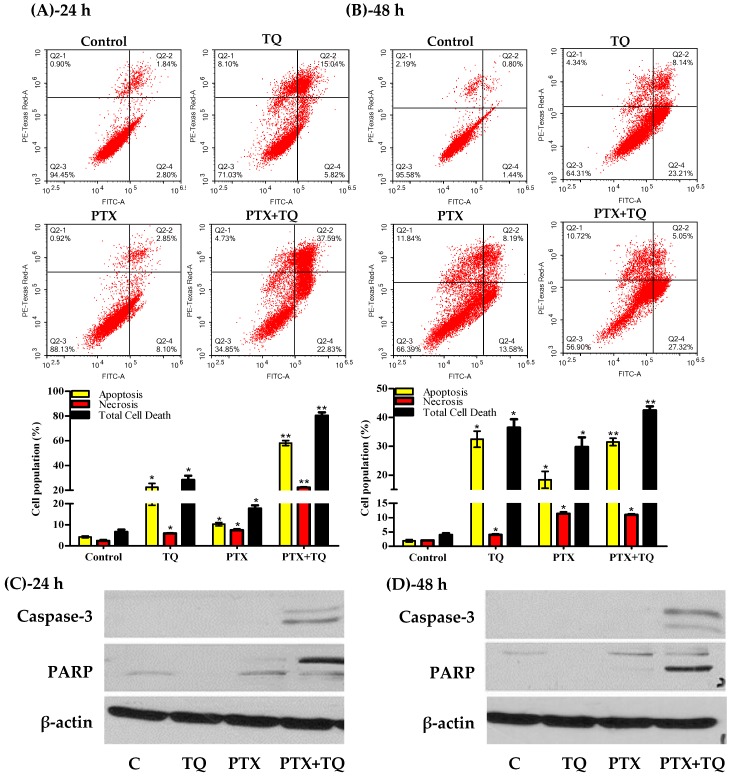
Figure 4.
Apoptosis/necrosis assessment in T47D cells after exposure to PTX, TQ, and their combination. Cells were exposed to PTX, TQ, or their combination for 24 h (A) and 48 h (B). Cells were stained with annexin V-FITC/PI and different cell populations are plotted as a percentage of total events. Western blot analysis for caspase-3 and PARP was assessed for MCF-7 (C) and T47D (D) cells. Data are presented as mean ± SD; n = 3. (*) significantly different from the control group. (**) significantly different from PTX treatment.

