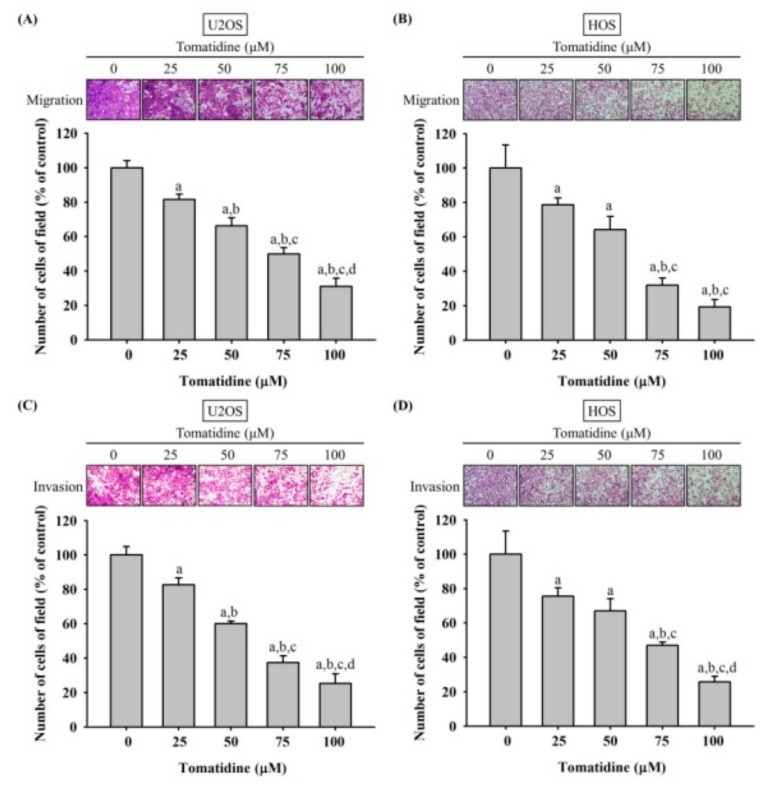
Figure 2.
Effects of tomatidine on in vitro cellular migration and invasion of U2OS and HOS cells. Cell migration (A and B) and invasion (C and D) assays after various concentrations (0, 25, 50, 75, and 100 μM) of tomatidine treatment for 24 h in U2OS and HOS cells were measured as described in the Materials and Methods section. Results are shown as mean ± S.D. n = 3. ANOVA analysis with Turkey’s posteriori comparison was used. (A) U2OS: F = 125.713, p < 0.001; (B) HOS: F = 56.973, p < 0.001; (C) U2OS: F = 159.838, p < 0.001; (D) HOS: F = 43.987, p < 0.001. a Significantly different, p < 0.05, when compared to the control. b Significantly different, p < 0.05, when compared to 25 μM. c Significantly different, p < 0.05, when compared to 50 μM. d Significantly different, p < 0.05, when compared to 75 μM.

