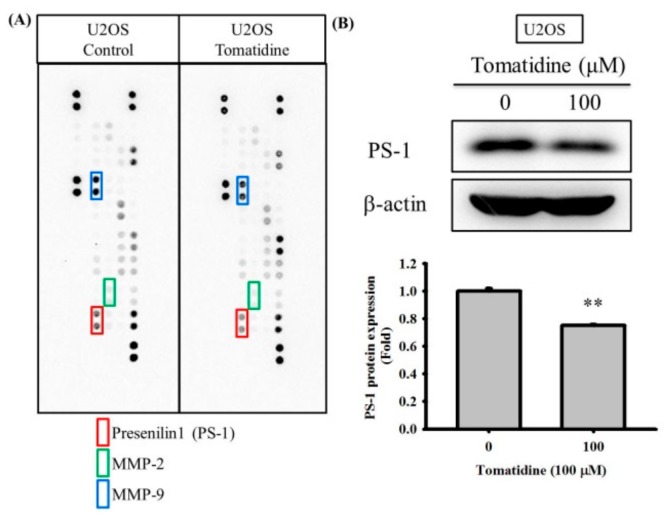
Figure 3.
Presenilin 1 expression of tomatidine-treated in osteosarcoma U2OS cells. (A) The protease array after treatment with 100 μM of tomatidine for 24 h in U2OS cells were employed as described in the Materials and Methods section. (B) Western blot analysis after various concentrations (0 and 100 μM) of tomatidine treatment for 24 h in U2OS cells were measured as described in the Materials and Methods section and the effects were illustrated after quantitative analysis. The results are shown as mean ± S.D. n = 3. Student’s t-test was used. (B) p = 0.001. **Significantly different: p < 0.01, when compared with the control group (0 μM).

