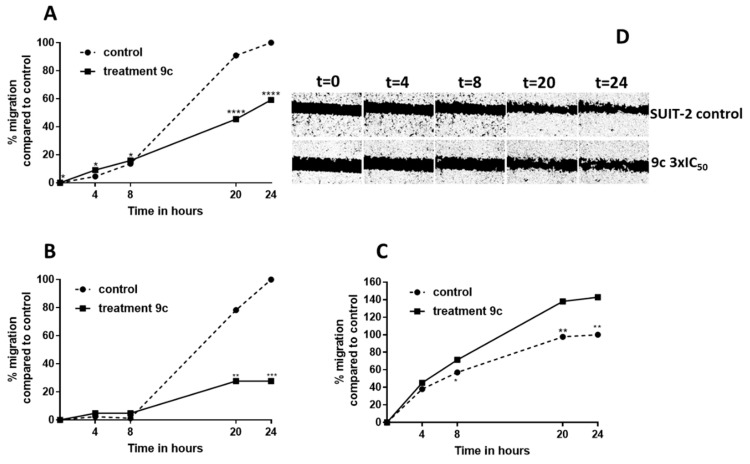
Figure 3.
Modulation of migration rate in SUIT-2, Capan-1 and Panc-1 cells treated with imidazo[2,1-b][1,3,4]thiadiazole compound 9c. The percentages of migration were monitored over time at 0, 4, 8, 20, 24 h in SUIT-2 (A), Capan-1 (B) and Panc-1 (C) cells treated with compound 9c at concentration of 3xIC50 values. Points represent the means of at least six different scratch areas. SEM were always below 10%. All the P values were calculated with Student’s-t-test. **** p < 0.0001, *** p < 0.001 ** p < 0.01, * p < 0.05. (D) Representative images of the scratch areas of SUIT-2 cells monitored over time (T = 0 and at 4, 8, 20 and 24 h from the start of the treatment). (Upper panels) untreated cells; (lower panels) cells treated with compound 9c. Original magnification 5×.

