Figure 3.
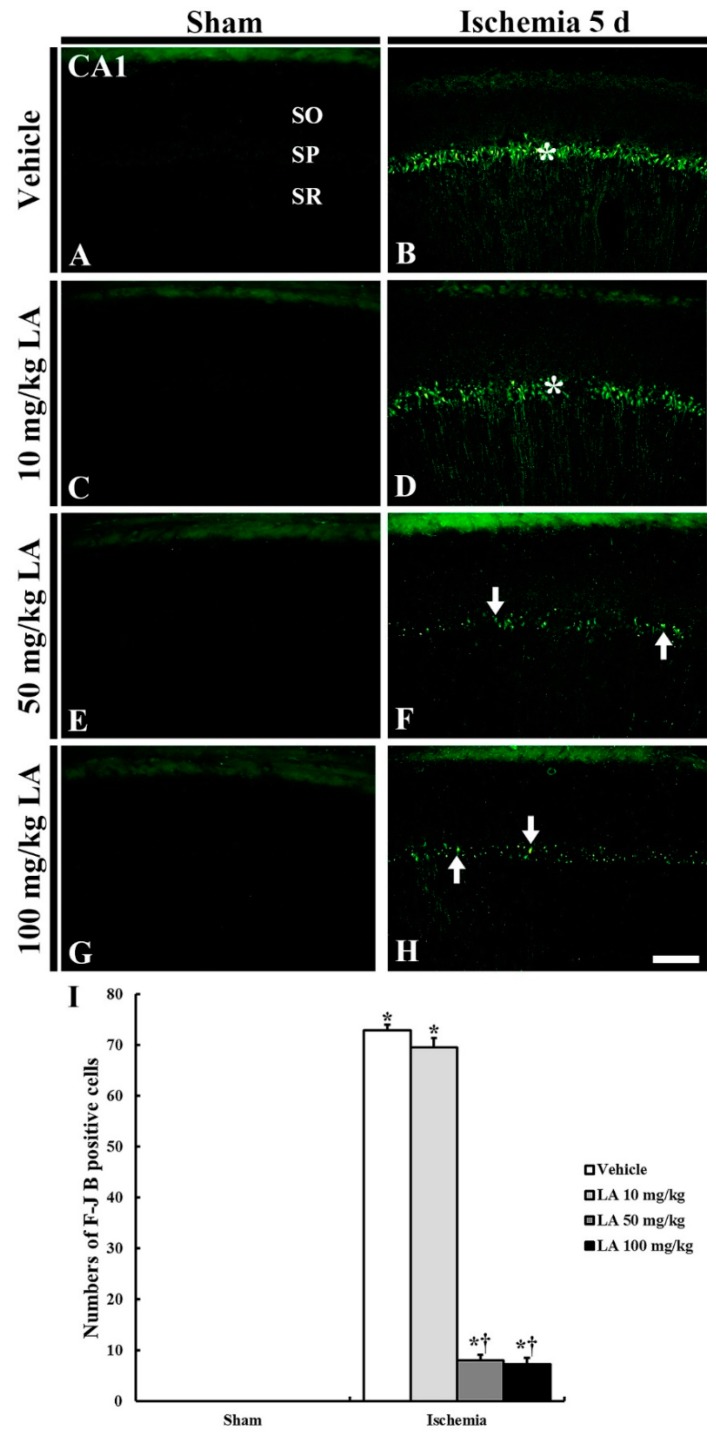
F-J B histofluorescence staining in the CA1 field of the vehicle/sham (A), 10, 50 and 100 mg/kg LA/sham (C,E,G), vehicle-ischemia (B) and 10, 50 and 100 mg/kg LA/ischemia (D,F,H) groups at 5 days after sham or TFI operation. In all the sham groups, no F-J B positive cells are found in the CA1 field; numerous F-J B positive cells are shown in the SP (asterisks) in the vehicle/ and 10 mg/kg LA/ischemia groups. However, in the 50 mg/kg and 100 mg/kg LA/ischemia groups, F-J B positive cells (arrows) are significantly decreased. Scale bar = 100 μm. (I) Mean number of F-J B positive pyramidal cells in the CA1 field at 5 days after TFI (n = 7 in each group, * p < 0.05 versus vehicle/sham group, † p < 0.05 versus vehicle/ischemia group). The bars indicate the means ± SEM.

