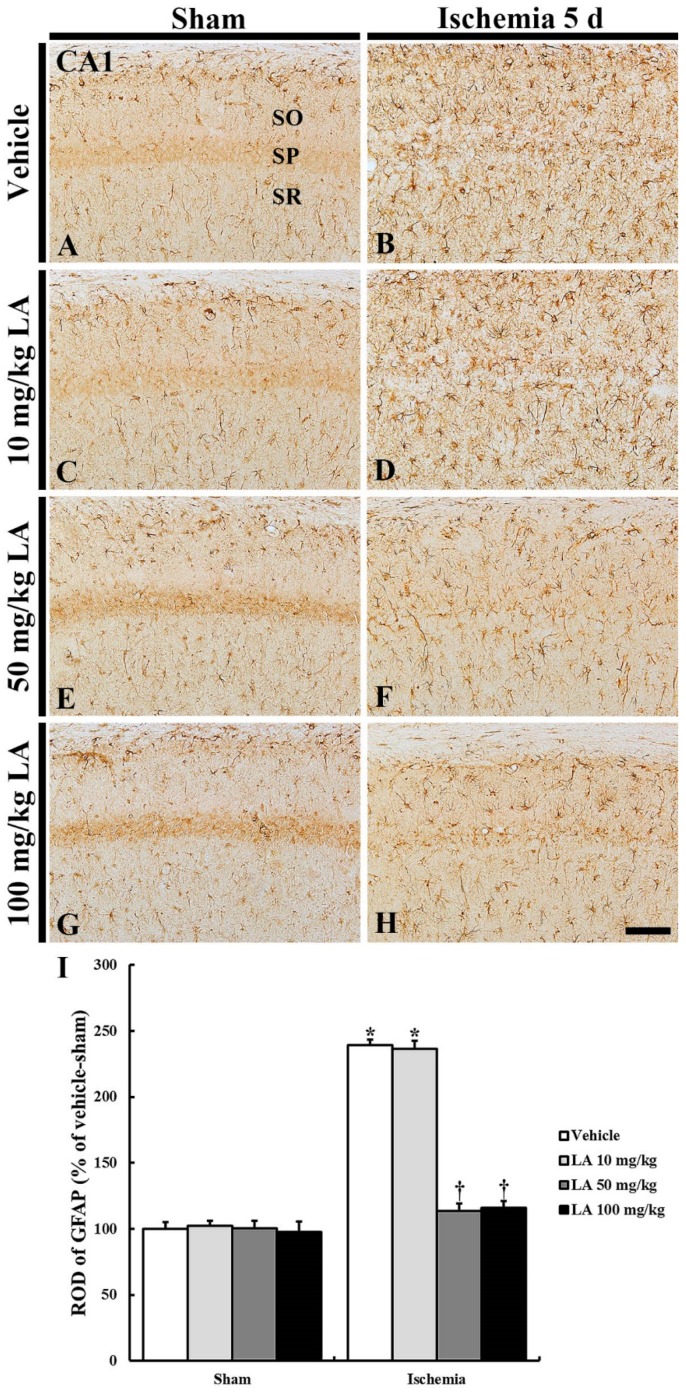
Figure 4.
Glial fibrillary acidic protein (GFAP) immunohistochemistry in the CA1 field of the vehicle/sham (A), 10, 50 and 100 mg/kg LA/sham (C,E,G), vehicle/ischemia (B) and 10, 50 and 100 mg/kg LA/ischemia (D,F,H) groups at 5 days after sham or TFI operation. In all the sham groups, typical GFAP immunoreactive astrocytes are generally distributed in the stratum oriens (SO) and radiatum (SR). In the vehicle/ischemia group, GFAP immunoreactive astrocytes are hypertrophied. In the 10 mg/kg LA/ischemia group, GFAP immunoreactive astrocytes are similar to those in the vehicle/ischemia group. In the 50 mg/kg and 100 mg/kg LA/ischemia groups, hypertrophy of GFAP immunoreactive astrocytes is apparently attenuated. Scale bar = 100 μm. (I) ROD (percentage) of GFAP immunoreactive structures in the CA1 field at 5 days after TFI (n = 7 in each group, * p < 0.05 versus vehicle/sham group, † p < 0.05 versus vehicle/ischemia group). The bars indicate the means ± SEM.

