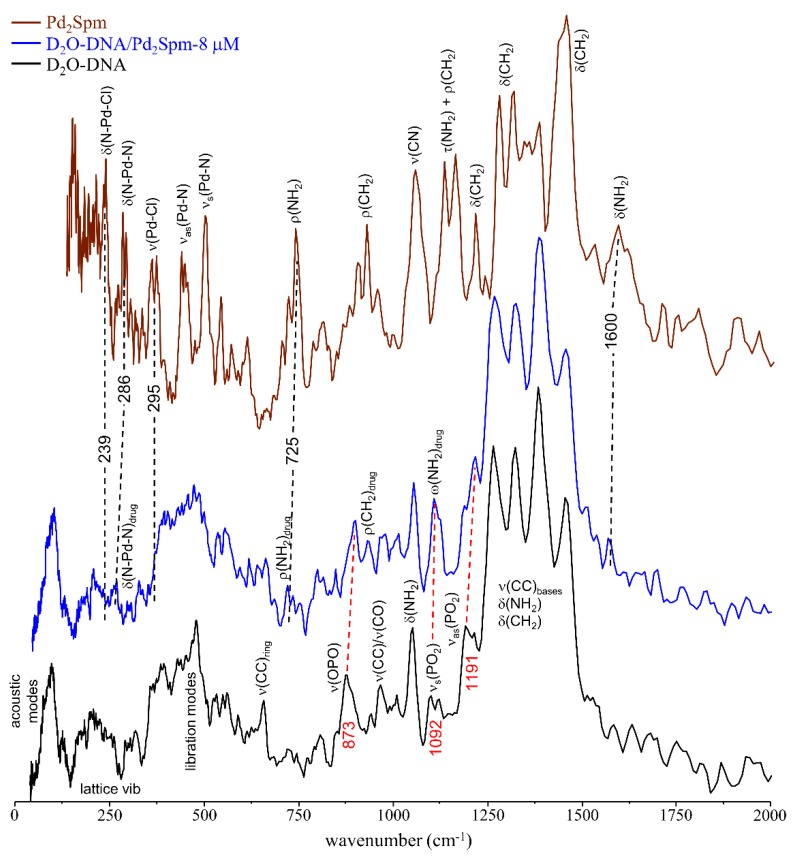
Figure 5.
INS spectra (at 10 K) of D2O-DNAhyd untreated and upon incubation (for 48 h) with Pd2Spm-8 µM. The spectrum of the free drug is also shown [17]. (The main drug-triggered vibrational changes are shown by red and black dashed lines and wavenumbers for DNA’s and Pd2Spm vibrational modes, respectively).

