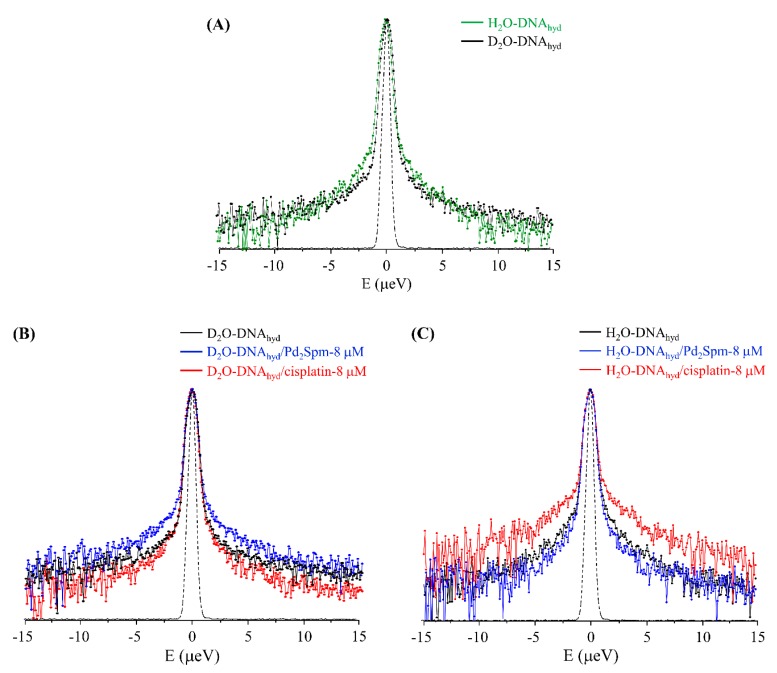
Figure 6.
QENS profiles (298 K, averaged over the entire Q range, logarithmic scale) for: (A) H2O-DNAhyd vs D2O-DNAhyd; (B,C) untreated and drug-exposed (8 µM) D2O-DNAhyd and H2O-DNAhyd, respectively.The spectra were normalised to maximum peak intensity. The black dashed line represents the instrument resolution.

