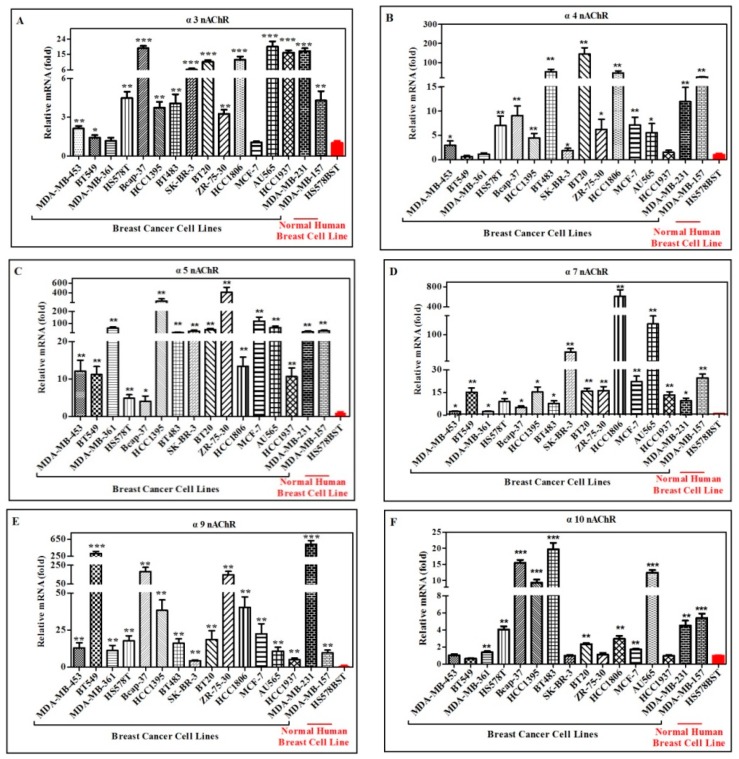
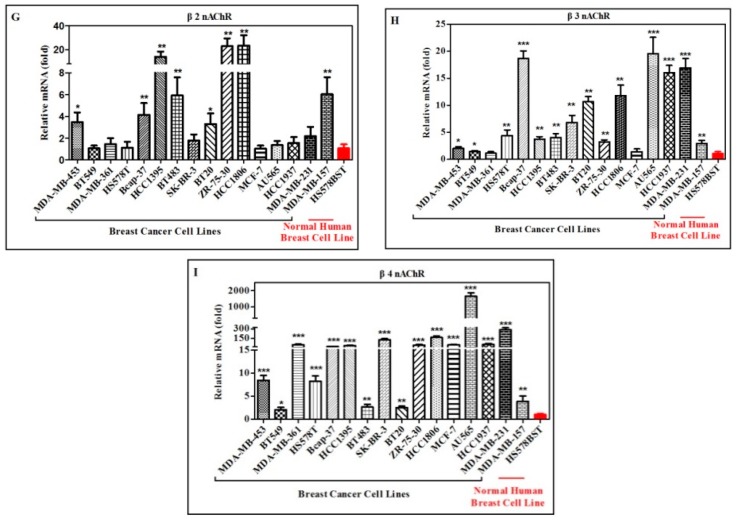
Figure 2.
Relative mRNA expression amount of different nAChR subunits in different human breast cancer cell lines and breast epithelial cell line HS578BST (normal control) detected by real-time PCR. Purified total RNA of each cell line with 1 μg was reverse-transcribed to cDNA using poly A primer. Expression level of each nAChR subunit mRNA was examined by real-time PCR using specific primers for each subunit in all the tested cell lines. (A–I) represent the expression of α3, α4, α5, α7, α9, α10, β2, β3 and β4 nAChR, respectively. * p < 0.05, ** p < 0.01, *** p < 0.001, breast cancer cells vs. normal cells HS578BST.


