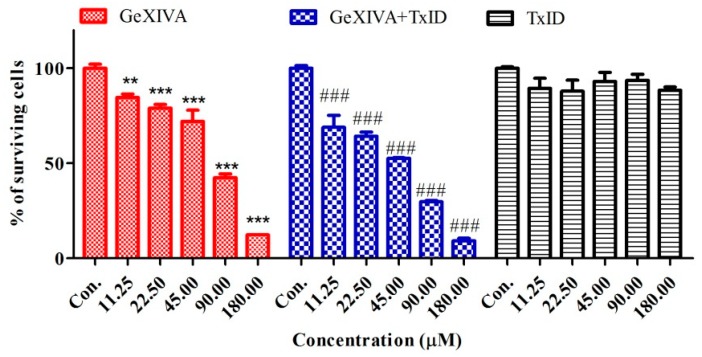
Figure 5.
Effects of α-conotoxin on the viability of breast cancer cells BT20. The cells were treated with various concentrations of α-conotoxin for 24 h. Then, the cell viability was determined by the CCK-8 assay. Values were expressed as mean ± SD of three independent assays. Statistical analysis was performed with one-way ANOVA. ** p < 0.01, *** p < 0.001, ### p < 0.001 for significant difference between treatments in comparison to control medium (Con.).

