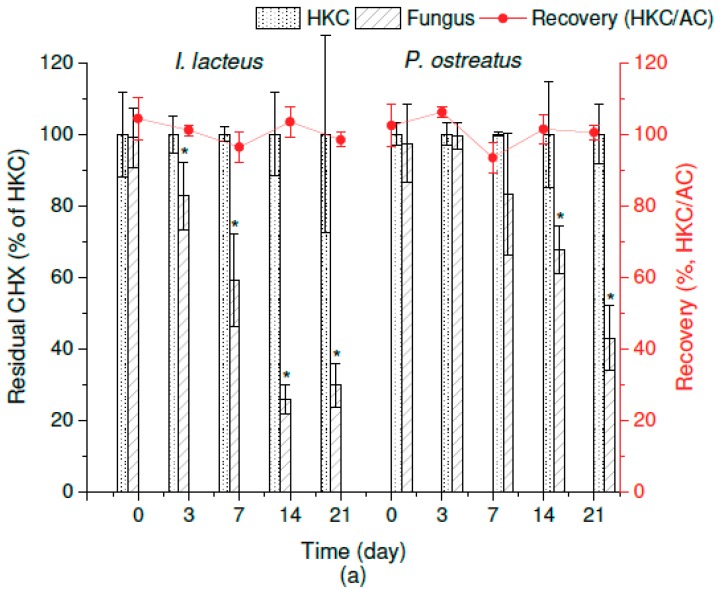
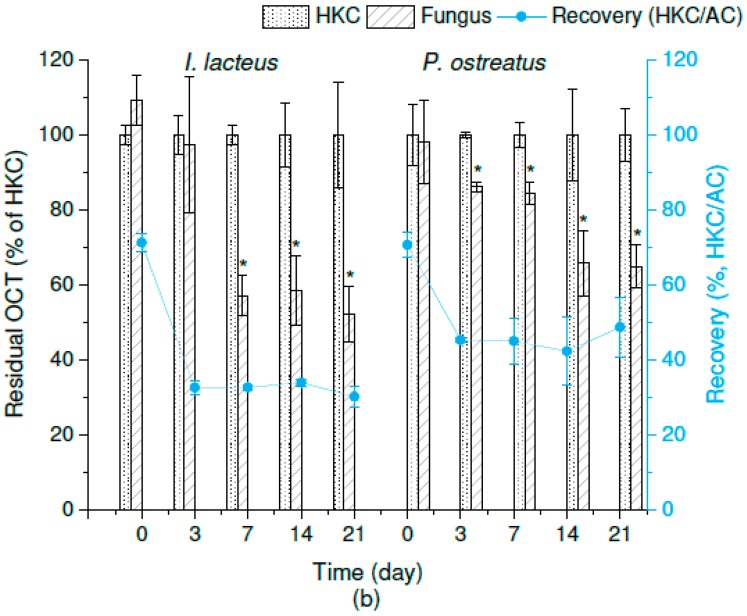
Figure 1.
Residual concentration of (a) chlorhexidine (CHX) and (b) octenidine (OCT) after the 21-day in vivo degradation by I. lacteus and P. ostreatus related to the respective heat-killed controls (HKCs). The red (CHX) and blue (OCT) line graphs show extraction recovery during the experiment expressed as the HKC and abiotic control (AC) ratio. Error bars represent standard deviation (n = 3). The asterisk marks a significant difference between the individual harvesting day and the control group—0 d (post hoc Dunnett’s Test).


