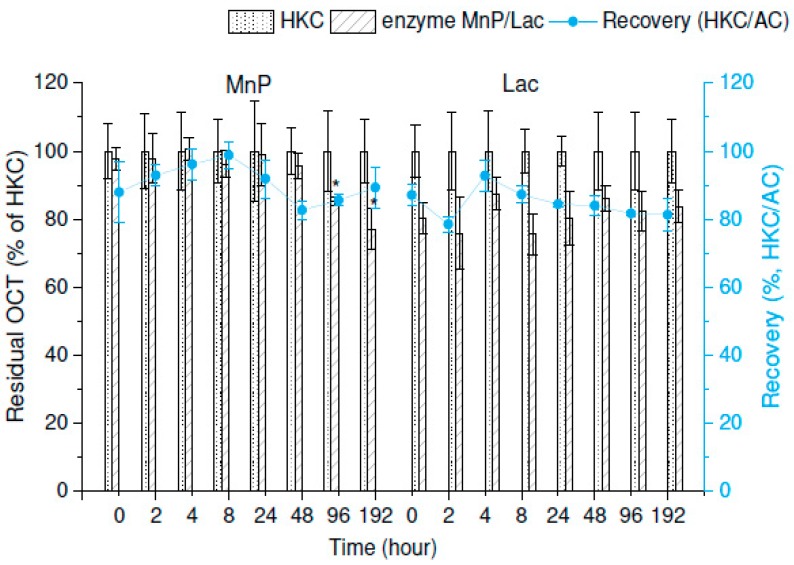
Figure 3.
In vitro degradation of octenidine (OCT) in concentrated extracellular liquids of I. lacteus (manganese-dependent peroxidase, MnP) and P. ostreatus (laccase, Lac). Initial concentration of OCT was 5 µg/mL in both experiments. The blue line graphs show the recovery of OCT extraction during the experiment expressed as the heat-killed control (HKC) and abiotic control (AC) ratio. Error bars represent standard deviation (n = 3). The asterisk marks a significant difference between the individual harvesting day and the control group—0 d (post-hoc Dunnett’s Test).

