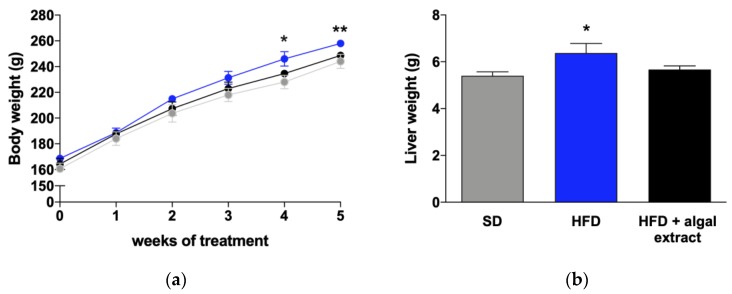
Figure 1.
Body weights (g) of rats during the 5 weeks of treatment (a) and liver weights (b) at sacrifice. Grey line = rats fed with standard diet (SD), blue line = rats fed with high-fat diet (HFD), and black line = rats fed with HFD + algal extract. Data are reported as mean ± S.E.M. * = p < 0.05 and ** = p < 0.01 vs. rats fed with SD.

