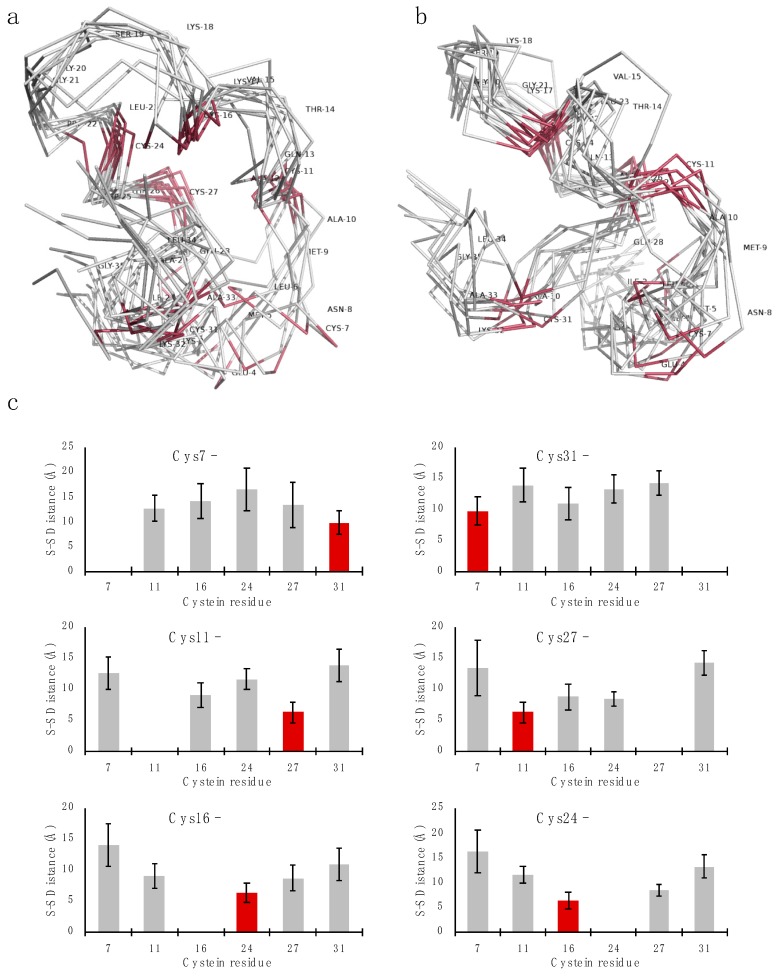
Figure 4.
Lowest-energy structure ensembles and average inter-cysteine distances for turgencin BMox2. Panels (a) and (b) show two views of the 10 lowest energy structure ensembles from simulated annealing with reduced disulfide bonds. Panel (c) plots illustrate the average distances from each cysteine sulfur to every other cysteine sulfur, indicating a C1-C6/C2-C5/C3-C4 disulfide pattern, as highlighted with red bars.

