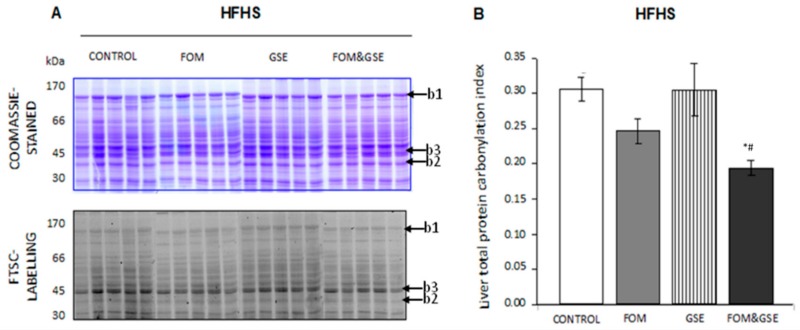
Figure 3.
Effect of FOM, GSE, and FOM&GSE on protein carbonylation index in liver from rats fed HFHS diets. (A) 1-DE Coomassie-stained gel (upper panel A) and 1-DE FTSC-stained gel (lower panel A) of liver proteins HFHS dietary groups. (B) Liver total protein carbonylation index measured in HFHS-CONTROL, -FOM-, -GSE-, and -FOM&GSE-fed rats. Results are means (standard deviation) (n = 5–7). * P < 0.05 vs. HFHS-C; & P < 0.05 vs. HFHS-FOM; # P < 0.05 vs. HFHS-GSE; $ P < 0.05 vs. HFHS-FOM&GSE. Comparisons were performed using the one-way ANOVA and Tukey post hoc tests. Images are representatives of three independent labelling experiments performed in triplicates. HFHS: high-fat and high-sucrose diet; GSE: grape seed polyphenols extract; FOM: fish oil mixture.

