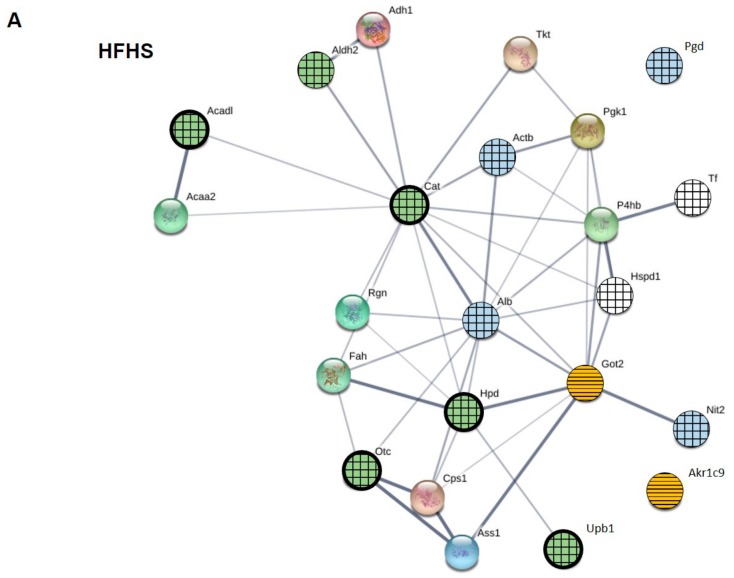
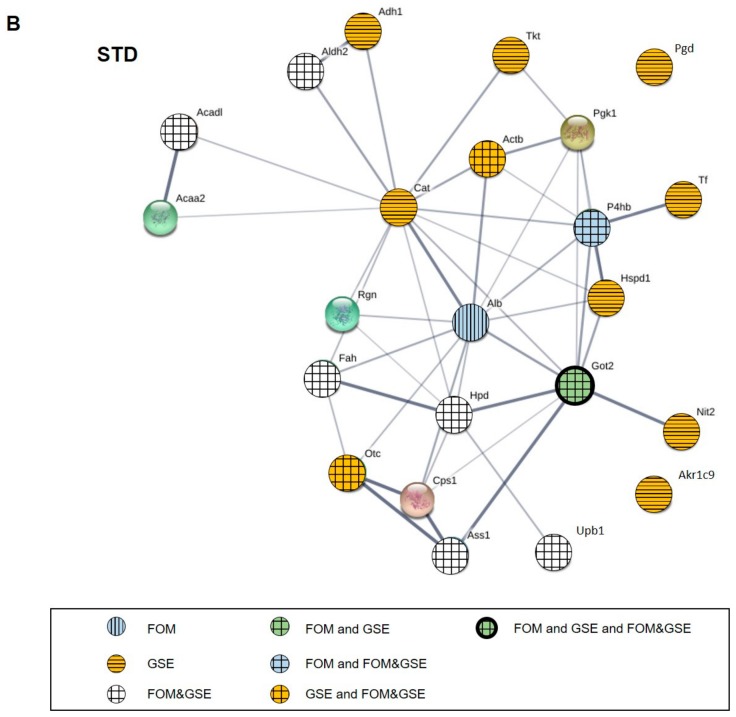
Figure 7.
Protein–protein interaction network of liver carbonylated proteins obtained by using the STRING software. (A) Proteins whose carbonylation level was modulated by fish oil mixture (FOM), grape seed polyphenols extract (GSE) and both when they were added to high-fat and high-sucrose (HFHS)-diets. (B) Proteins whose carbonylation level was modulated by FOM, GSE and both when they were added to standard (STD)-diets. Nodes (circles) represent carbonylated proteins list in Table 3 and are labelled according to gene name. Lines (edges) indicate the known interrelationships. Thicker lines represent stronger associations.


