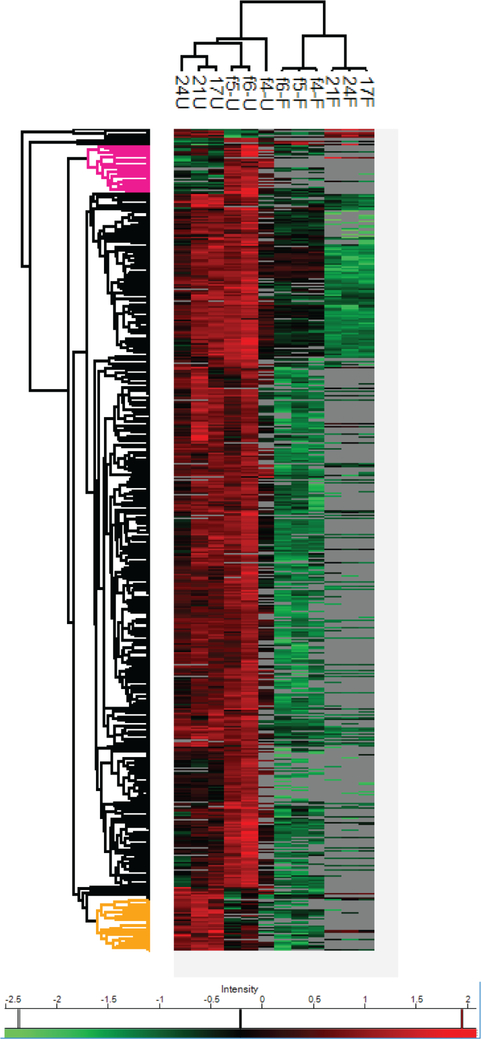
Figure 6.
Heatmap visualization of protein expression profiles of human pancreas from various ages before and after decellularization process. A dendrogram of two pancreas ages (fetal and adult) with two experimental conditions (native (U) and decellularized (F) pancreas) (17U, 21U, and 24U for adult native; 4f-U, f5-U, and f6-U for fetal native; 17F, 21F, and 24F for adult decell; f4, f5, and f6 for fetal decell) was shown at the top. Protein expression values were Z-score normalized prior to clustering. Hierarchical clustering of protein expression profiles identified four groups. The cluster of proteins with higher abundance in fetal pancreas was highlighted in pink. The cluster of proteins with higher abundance in adult tissues was highlighted in yellow.

