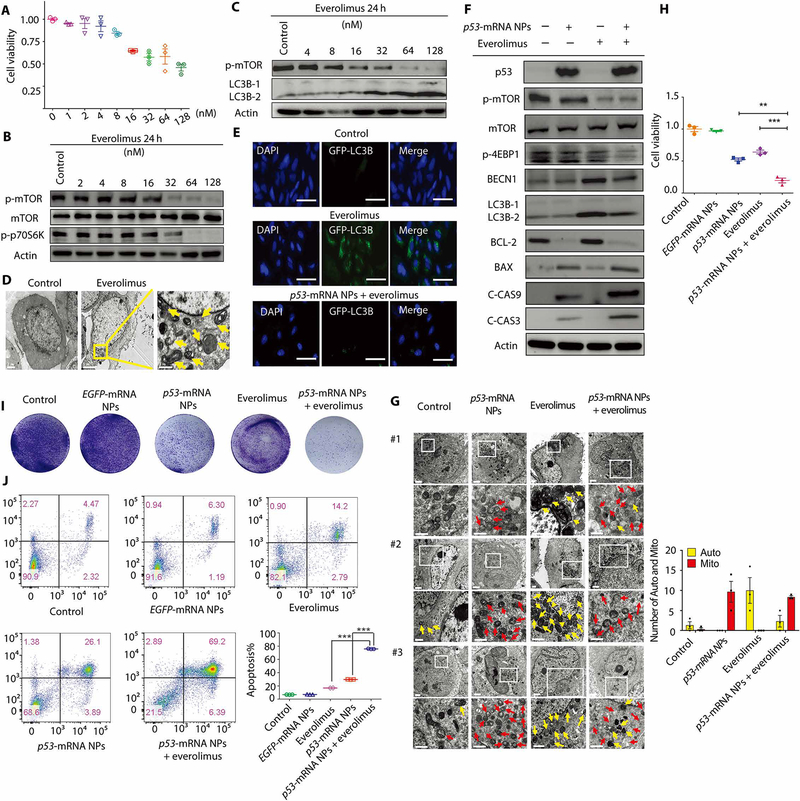
Fig. 3. Mechanisms of the p53-mRNA NP–mediated sensitization to everolimus in p53-null Hep3B cells.
(A) Viability of Hep3B cells after treatment with everolimus, as measured by AlamarBlue assay. Data shown as means ± SEM (n = 3). (B) WB analysis of total mTOR, p-mTOR, and p-p70S6K after treatment with everolimus at different concentrations. Actin was measured as the loading control. (C) WB analysis of p-mTOR, LC3B-1, and LC3B-2. Actin was measured as the loading control. (D) TEM images of Hep3B cells before and after 24 hours of treatment with everolimus (32 nM). Autophagosomes were labeled by yellow arrows. Scale bars (left to right), 2, 5, and 1 μm. (E) CLSM images of GFP-LC3–transfected Hep3B cells from different treatment groups. Scale bars, 50 μm. (F) WB analysis of p53, p-mTOR, total m-TOR, p-4EBP1, BECN1, LC3B-1, LC3B-2, BCL-2, BAX, C-CAS9, and C-CAS3 in Hep3B cells after different treatments. Actin was used as the loading control. (G) Left: TEM images of Hep3B cells in control, p53-mRNA NPs, everolimus, and p53-mRNA NPs + everolimus groups (mRNA concentration: 0.415 μg/ml; everolimus concentration: 32 nM). Scale bars, 2 μm for the raw images and 1 μm for the enlarged images. Yellow arrows, autophagosomes; red arrows, mitochondria. Right: Statistical analysis of the numbers of autophagosomes (Auto; yellow) and swollen mitochondria (Mito; red) after different treatments. (H) Viability of Hep3B cells in different groups (control, EGFP-mRNA NPs, p53-mRNA NPs, everolimus, or p53-mRNA NPs + everolimus) as measured by AlamarBlue assay (mRNA concentration: 0.415 μg/ml; everolimus concentration: 32 nM). Data shown as means ± SEM (n = 3), and statistical significance was determined using two-tailed t test (**P < 0.01, ***P < 0.001). (I) Colony formation of Hep3B cells in different treatment groups in six-well plates. (J) Flow cytometry analysis of the cell apoptosis (AnnV+PI− and AnnV+PI+). The percentage of apoptotic Hep3B cells was shown in the histogram. Statistical significance was determined using two-tailed t test (***P < 0.001).

