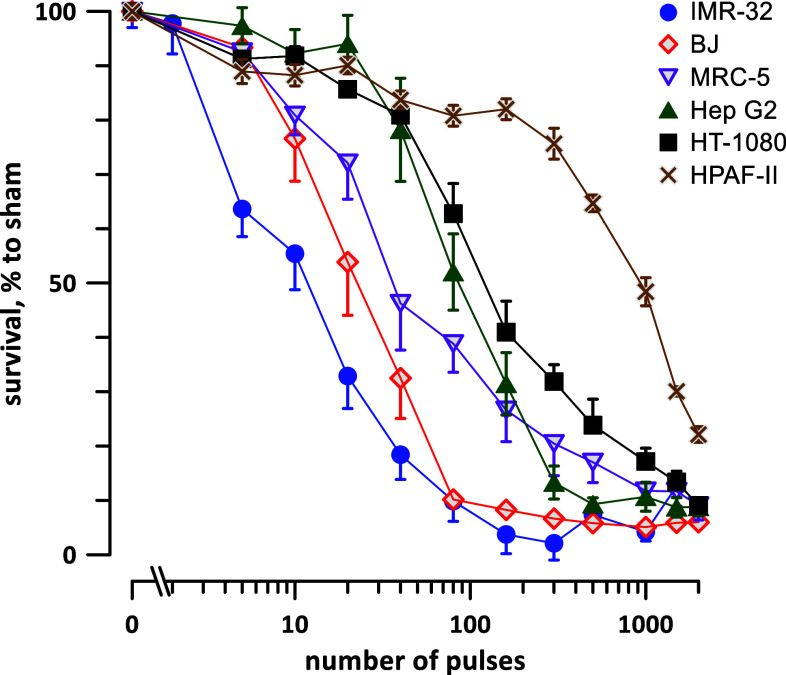
Fig. 2.
Highly selective sensitivity of different cell lines to 300-ns PEF. The plots display cell survival 20 h after exposure to different numbers of 300-ns pulses (1.8 kV/cm, 50 Hz). The survival was normalized to the sham-exposed parallel control, mean ± SEM, 9–18 independent experiments per data point. For clarity, most error bars are plotted in one direction only and significant differences are not marked, see text and Table 1. Note the log scale for abscissa

