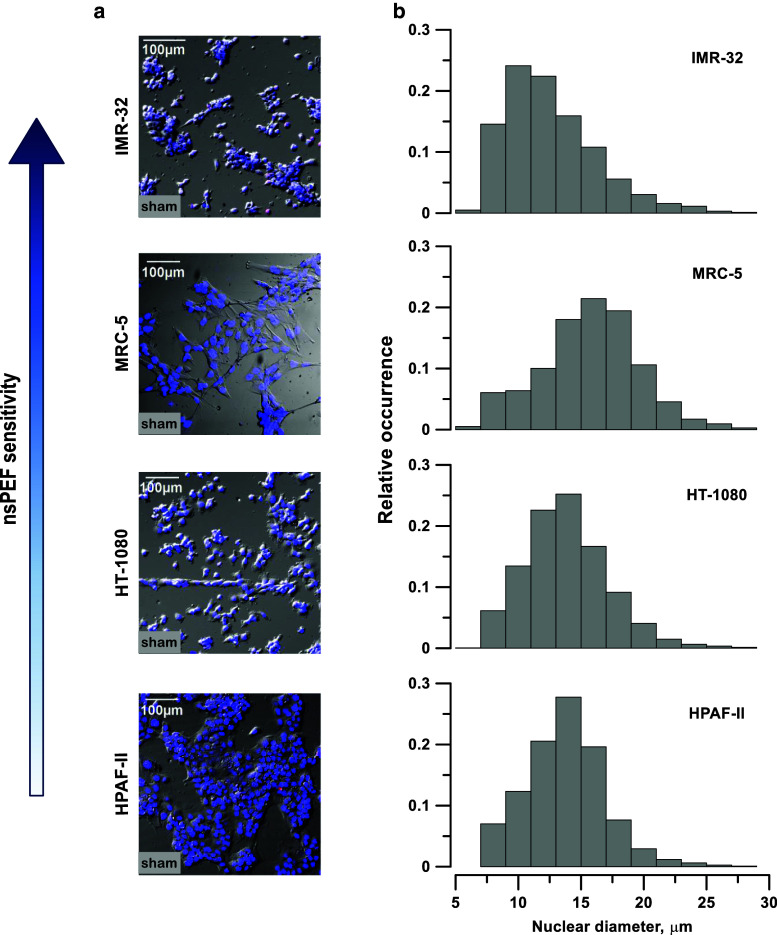
Fig. 4.
nsPEF sensitivity has no apparent correlation with cell shape, size, or growth pattern (a) or with nucleus size (b). a Representative images of monolayers of IMR-32, MRC-5, HT-1080, and HPAF-II cells on ITO coverslips in control samples (no PEF exposure). Cell nuclei were labeled with Hoechst dye (blue), and fluorescence was laid over DIC images. Cells most sensitive to nsPEF are at the top and the least sensitive at the bottom. b Bar plots showing the frequency distributions of the nuclear diameters in the same cell lines; 2000–3000 cells were measured per group. MRC-5 cells, which have an intermediate sensitivity to nsPEF, had the largest diameter nuclei

