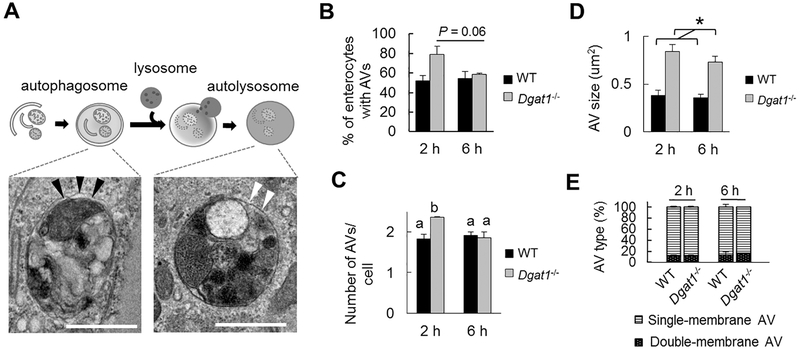
Figure 2. Accumulation of AVs and increased size of AVs in enterocytes of Dgatl−/− compared to WT mice after a dietary fat challenge.
(A) Representative electron micrographs of AVs in different stages of autophagy: an early-staged, double-membrane AV that contains undigested cellular components (left) and late-staged, single-membrane AVs that contain partially digested material (middle) or amorphous electron-dense material (right). Black arrows indicate doublemembrane structures. White arrows indicate single membrane structure of AVs. Scale bar = 1 μm. (B) Percent of enterocytes containing AVs in WT and Dgatl−/− mice after oil gavage. (C) Mean number of AVs in an individual cell and (D) mean size of the identified AVs in WT and Dgatl−/− mice. (E) Proportions of double-membrane and single-membrane AVs in WT and Dgatl−/− mice. A two-way ANOVA with Tukey post hoc test was used for consideration of the two main factors (genotype and time) and their interaction (n = 3 mice/group). Significant effect of genotype (*) and time (†) are reported for P < 0.05. When the interaction resulted in significant differences, letters are used to indicate differences between groups at P < 0.05.

