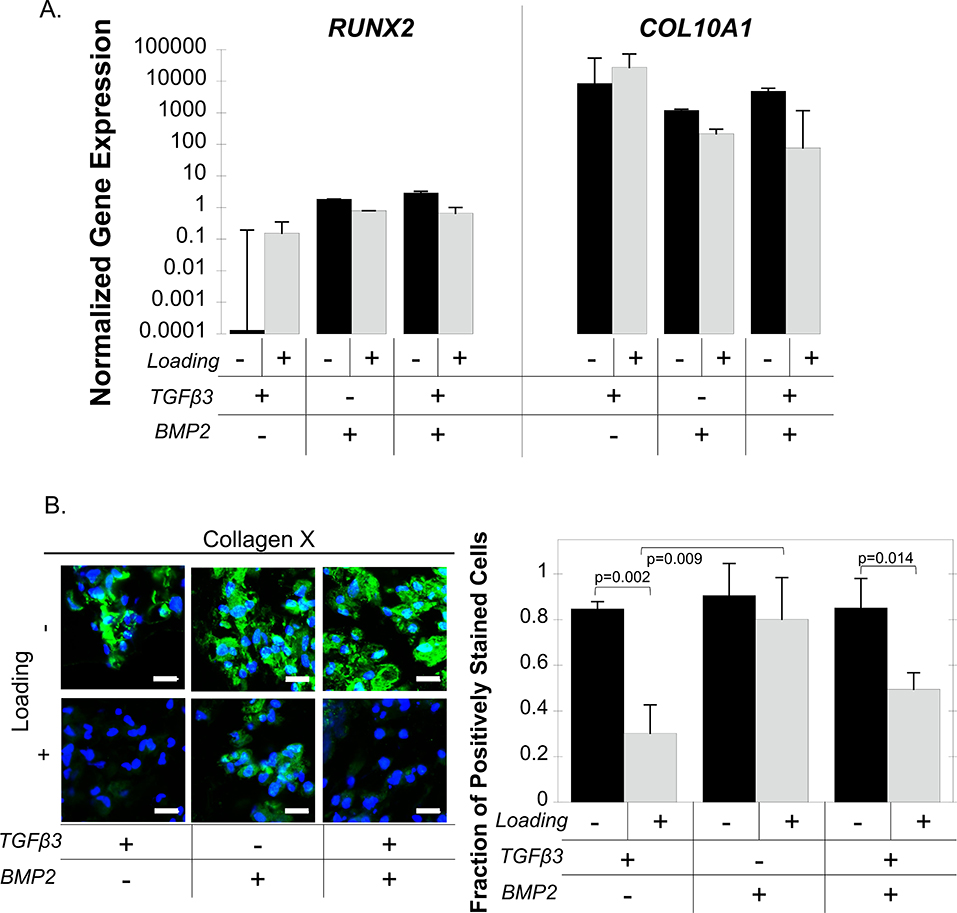
Figure 6.
IPS-MP-laden hydrogels cultured without and with loading with TGFβ3, BMP2, and TGFβ3+BMP2 for 21 days. A.) Gene expression data for hypertrophic markers RUNX2 and COL10A1 at day 21 normalized to pre-encapsulated iPS-MPs cultured under free swelling (black) and loading (gray). B.) Representative confocal microscopy images of ECM protein collagen X (green) and nuclei (blue) and quantitative analysis of the fraction of collagen X positively stained cells at day 21 of iPS-MPs cultured under free swelling (black) or loading (gray). Scale bar is 20 μm. Data presented as mean with standard deviation (n=3).

