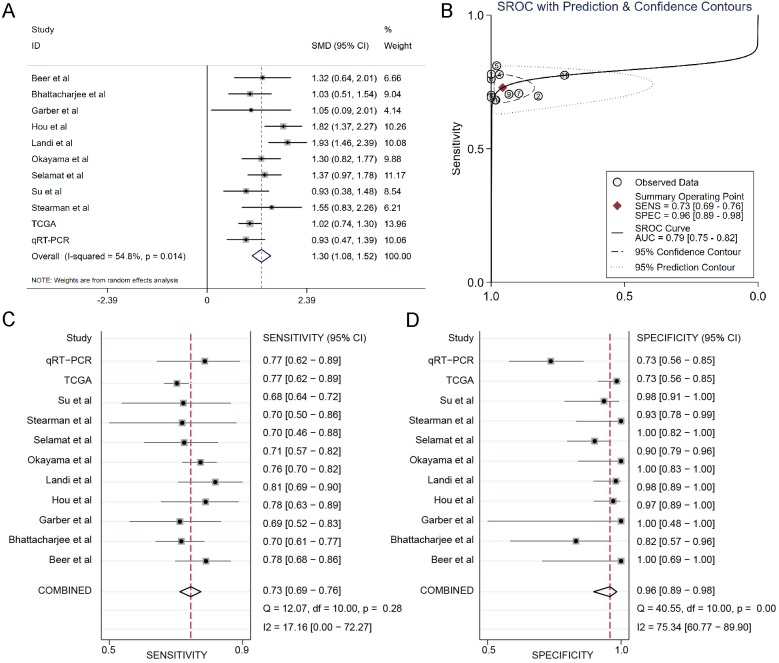
Figure 3. Integrated meta-analysis based on qRT-PCR, TCGA and 9 Oncomine datasets.
(A) Forest plot of the DSG2 expression. (B) SROC of DSG2 in the LUAD within the total 11 datasets included. Sensitivity (C) and specificity (D) analysis of DSG2. The black squares represent the sensitivity /specificity value of each dataset. The horizontal lines indicate the 95% confidence intervals of each study. The diamonds represent the effect size.

